Posted by DC31k on 08/10/2022 11:30:23:
What does the data stream look like? …
+1, or putting it another way, how do the electronics work?
One way of creating an image is to sweep X from side to side to draw a line of horizontal dots and then sweep Y from top to bottom to draw lines of dots. This is how analogue TVs work. The image is pre-calculated.
Another is to place each dot according to it's X,Y coordinate, in which case there's no need to scan. The line flows like handwriting.
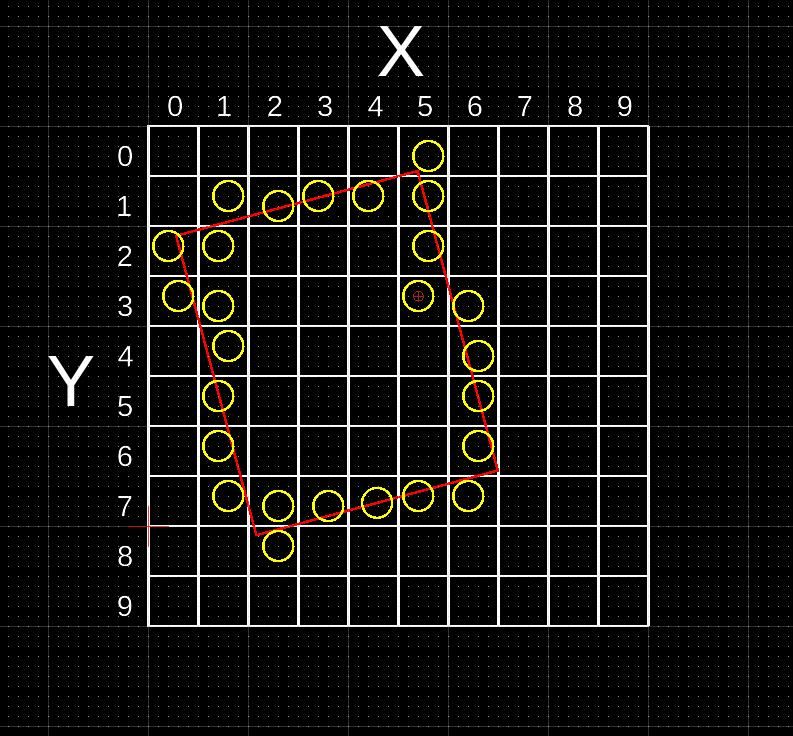
In this example, my screen is 10 x 10 pixels, and I have a rectangle (in RED) tilted at 15° to print on it. Which pixels should be ON and in what order will the electronics draw them?
By convention computer graphics put 0,0 at top left.

ON pixels between corners are calculated and are in bold.
The scan approach would set Y=0, and send 0,0,0; 1,0,0; 2,0,0; 3,0,0; 4,0,0; 5,0,1; 6,0,0; 7,0,0; 8,0,0; 9,0,0;
Then Y=1, and send 0,1,0; 1,1,1; 2,1,1; 3,1,1; 4,1,1; 5,1,1; 6,1,0; 7,1,0; 8,1,0; 9,1,0;
Then Y=2 and send 0,2,1; 1,2,1; 2,2,0; 3,2,0; 4,2,0; 5,2,1; 6,2,0; 7,2,0; 8,2,0; 9,2,0;
And so on up Y=9
The handwriting approach would just send ON coordinates: 5,0,1; 1,1,1; 2,1,1; 3,1,1; 4,1,1; 5,1,1; 0,2,1; 1,2,1; 5,2,1; etc.
Practically, it's usual to pre-calculate the matrix, and drive the screen's electronics from that. It is possible to calculate the X,Y coordinates needed to draw a line on the fly, but it's easier not too. (There's a need to repeat frames so people can see the image.)
A computer display driver uses precomputed images. The software draws on an matrix called a frame buffer. This is an area of memory organised like my simple 10×10 matrix except it's extended to allow colour and intensity. Each display has a device driver that translates the image in the frame buffer into whatever format the display electronics need. Could be a JPG, or rasters for an Analogue TV, HPJL pen movements, postscript commands, HDMI, or whatever. The driver does other stuff like scale the image to fit, sort out colour profiles and so forth that aren't necessary for a simple set-up.
A rectangle is defined as the four coordinates of it's corners. Scaling and rotating are done on these four coordinates. Keeps the object definitions simple.
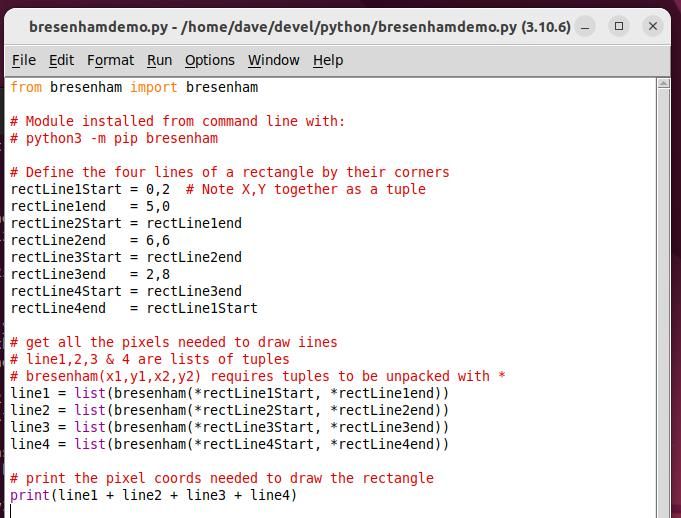
To draw the rectangle, an algorithm calculates which pixels between each corner need to be ON to draw a line. Bresenham is famous for his way of calculating lines and circles efficiently so it's usual to copy him. The pixel settings can be stored in a list and sent to a device that understands the list.
I would implement this in three stages:
- A PC program (I'd use Python) that captures the object's initial coordinates and calculates the pixels needed to draw lines, connected to
- An Arduino that reads PC created coordinates and translates/interfaces with the electronics. (Written in C, how complicated depends on what the electronics need as input)
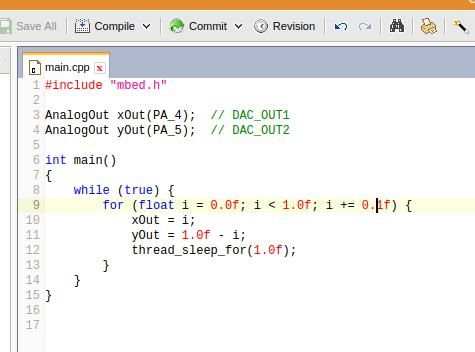
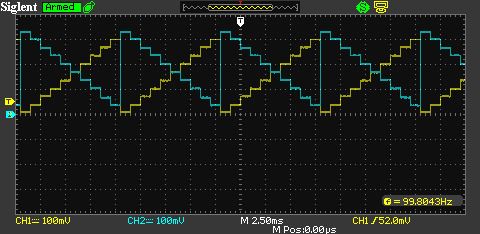
- The electronics driving the oscilloscope's X,Y and putting pixels on/off. Gut feel, two Digital to Analog Converters and an ON/OFF switch for Z would do it
However, it does depend on how easy to produce the graphics need to be. For a one off demo, the coordinate list can be created manually by drawing it on graph paper, but this soon gets tedious!
An easily missed point is the need to refresh the display repeatedly until the human eye registers the image! Partly depends on the persistence of the oscilloscopes phosphor, but the display should hold the picture for about 35mS before moving to the next frame.
I don't know off-hand of a program that allows shapes to be drawn and outputs the result as a simple list of XY coordinates. Most users want complex outputs like JPG. I'll have a think.
Interesting project! But can the electronics be explained please?
Dave
Edited By SillyOldDuffer on 08/10/2022 13:39:40
 Barry Smith 4.

