JoNo’s Pendulum
JoNo’s Pendulum
Home › Forums › Clocks and Scientific Instruments › JoNo’s Pendulum
- This topic has 153 replies, 10 voices, and was last updated 4 October 2023 at 16:16 by
SillyOldDuffer.
-
AuthorPosts
-
29 August 2023 at 01:43 #658350
Sam Stones
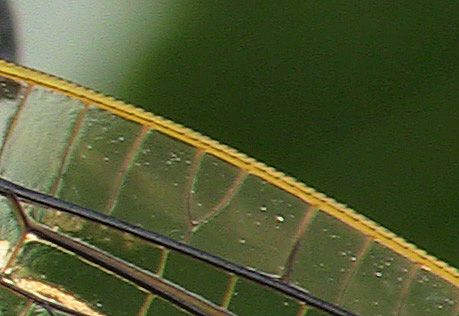
Participant@samstones42903Reference the above whale flipper link Jo, I couldn’t resist chipping in with this…
…the leading edge of a dragonfly wing.
Apparently, for whales, the tubercles provide swifter manoeuvrability. That would be handy for a dragonfly too.
And how about the leading and trailing edges of a pendulum rod with a suitably shaped (elliptical) cross section?
By the way, that’s brilliant work you are doing Jo!
Sam
 29 August 2023 at 07:16 #658357
Joseph Noci 1
Participant@josephnoci1Posted by Sam Stones on 29/08/2023 01:43:26:Reference the above whale flipper link Jo, I couldn’t resist chipping in with this…
…the leading edge of a dragonfly wing.
Apparently, for whales, the tubercles provide swifter manoeuvrability. That would be handy for a dragonfly too.
And how about the leading and trailing edges of a pendulum rod with a suitably shaped (elliptical) cross section?
By the way, that’s brilliant work you are doing Jo!
Sam

Absolutely amazing how Nature builds structures that challenge and overwhelm all man's scientific methods! That wing is gossamer thin and as strong as steel, but weighs nothing…Nice photo Sam.
I have/had all sorts of ideas for the bob and rod – as you are suggesting, but modelling such concepts is difficult and at pendulum velocities, involves lots of guesswork and many assumptions. To obtain definitive results an approach would be to use a functional, stable pendulum, and then make such a rod, for example, and see its effect on the performance. The problem is always, digging out the delta from all the other delta's – temp, humidity, etc. A road to Hell…and it takes a long time…
Edited By Joseph Noci 1 on 29/08/2023 07:22:31
29 August 2023 at 08:54 #658363John Haine
Participant@johnhaine32865Really interesting system Joe. A couple of questions.
How do you filter the signal from the synchronous detector? There was a long debate in HSN between Matthys and Bigelow about the significance of any phase shift in the sinusoidal drive oscillator loop. Bigelow used a very simple oscillator circuit where the pendulum was the resonator, using a single op-amp and (zener?) diodes to limit amplitude. The op-amp GBW was 1 MHz, so there was a small excess phase shift at 0.5 Hz which meant that the impulse wasn't quite in phase with the pendulum. Bigelow thought that this was insignificant, Matthys was concerned, I think there's a whole chapter in his book that reflects this debate.
I'm also interested in how you achieve the 90* phase shift needed for the pendulum drive, at 0.5Hz!
I've wondered about sinusoidal drive for my clock, but not having a proportional angle sensor would probably mean having to phase-lock a digital system and synthesising the sine wave.
29 August 2023 at 10:23 #658379Joseph Noci 1
Participant@josephnoci1John,
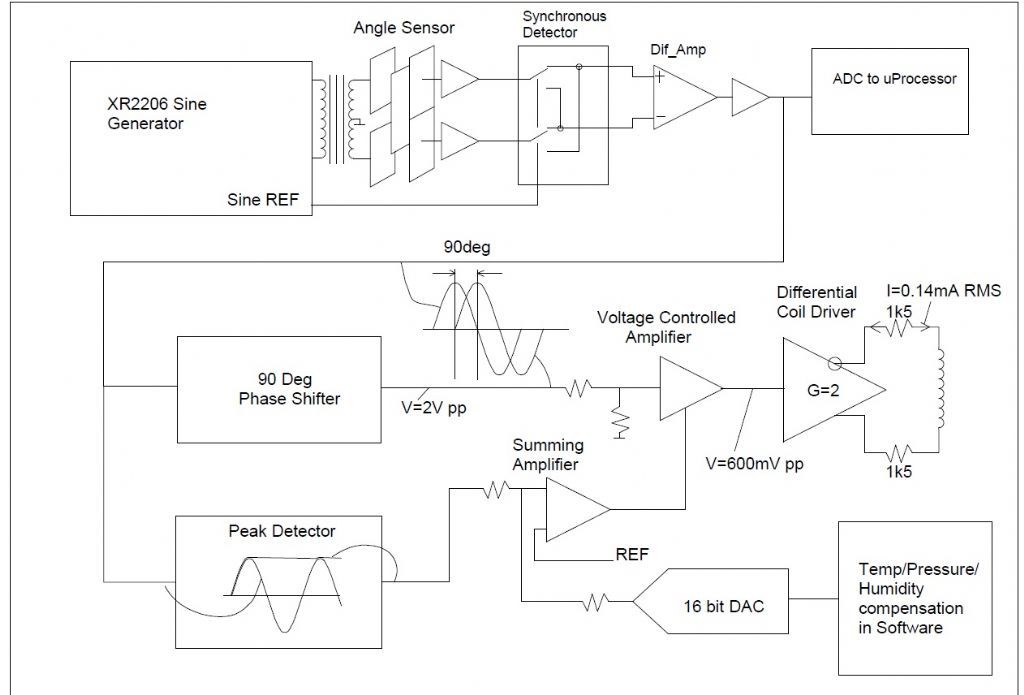
The Sync detector filter is a low pass with cutoff @ 1KHz. The angle sensor runs at 5KHz, so 1KHz cutoff is OK and the phase shift on that signal is very low in the 0.5Hz domain.
I read in detail the Bigelow texts re his oscillator, also the details in Matthuys – studied and modelled his circuits in Simulink, etc, but I believe the concept and approach is flawed – clipped sine wave will always cause perturbations – The 'thermal' analogue multiplier has interesting potential – rids signals of some noise issues, but not sure it is worth the effort. In addition, that concept provides no means of adjusting phase if in error/needed.
You said –
The op-amp GBW was 1 MHz, so there was a small excess phase shift at 0.5 Hz which meant that the impulse wasn't quite in phase with the pendulum.
Did you mean impulse? I guess so, since the clipped sine is more 'impulsive' – What I have tried to implement is really a 'pure' sine, at least as pure as the pendulum swing, with the coil current always in tune with the pendulum position and velocity – it can never differ, only the lead/lag can differ by changing the 90deg phase shift, and that is the ideal control point input.
The op-amps I used are 2MHz GBW, except for the differential instrument amp after the Sync detector – that is 500KHz. However, any build up of phase shift become unimportant as the 90deg shifter can be adjusted to shift by the amount needed to lock the loop. The peak detector voltage is monitored and that will stabilize while the final PID loop ( too be implemented still!) controls either to VGA gain, or the phase shifters setpoint.
OP amp choices are always a trade-off – I want really low noise and really good input offset performance, but that tends to oppose higher GBW, so overall system compensation is the way to go..
My 90Deg shifter is purely analogue right now – an all pass filter with 90deg point set at 0.5Hz. I will most likely implement this digitally – either a FIR all-pass or Hilbert transform – for concept testing right now the analogue all pass works just fine! It will have shift drift due to the tempco of the C's in the filter, but I believe all tempco's can be compensated for at system level, ie, an overall temp compensation, rather than compensating each circuit element.
If you want details of the angle sensor, I am happy to give my drawings and circuits – Do you have a desktop CNC router? Easy then to make the capacitor elements with FR4 PCB.
29 August 2023 at 11:23 #658385SillyOldDuffer
Moderator@sillyoldduffer29 August 2023 at 20:40 #658422Sam Stones
Participant@samstones4290329 August 2023 at 22:45 #658431Joseph Noci 1
Participant@josephnoci1Did a few runs today and logged data to calculate Q – Not impressive, but I think definitive.
The Processor reads data from – Angle sensor (sinusoid), Angle Peak detector, and all the temperature sensors, humidity and pressure. The angle and peak detectors are sampled at 200Hz and can be logged at 200Hz, 100Hz, 50Hz, 20Hz and 10Hz. 200Hz fills large files fast…
With the pendulum running and the control loop stable, the drive voltage to the drive coil was then disconnected and the pendulum angle data logged at 50Hz.
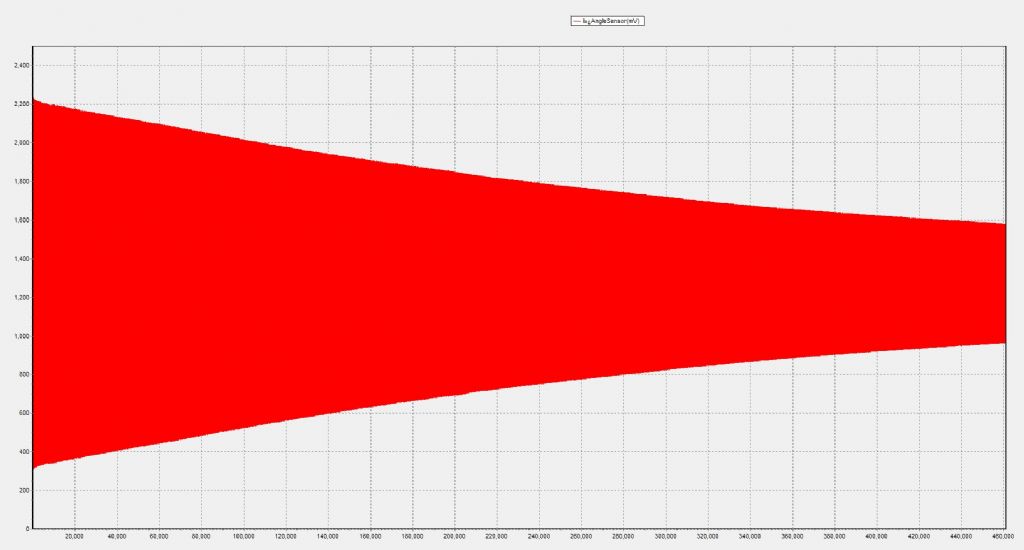
This plot is 2-1/2 hours of data at 50Hz. The data was analysed at the points where the amplitude had fallen by:
61% – Q = 12000
50% – Q = 12400
31.8% Q = 14514
50Hz data log of pendulum sinusoid amplitude over time:
It is interesting that the Q increases with extended run-time. The amplitude of the swing at the start was 2deg full swing – Q seems to increase usefully with reduced swing angle. I will try another run with a 1.5deg full swing angle from the start to see if this is so.
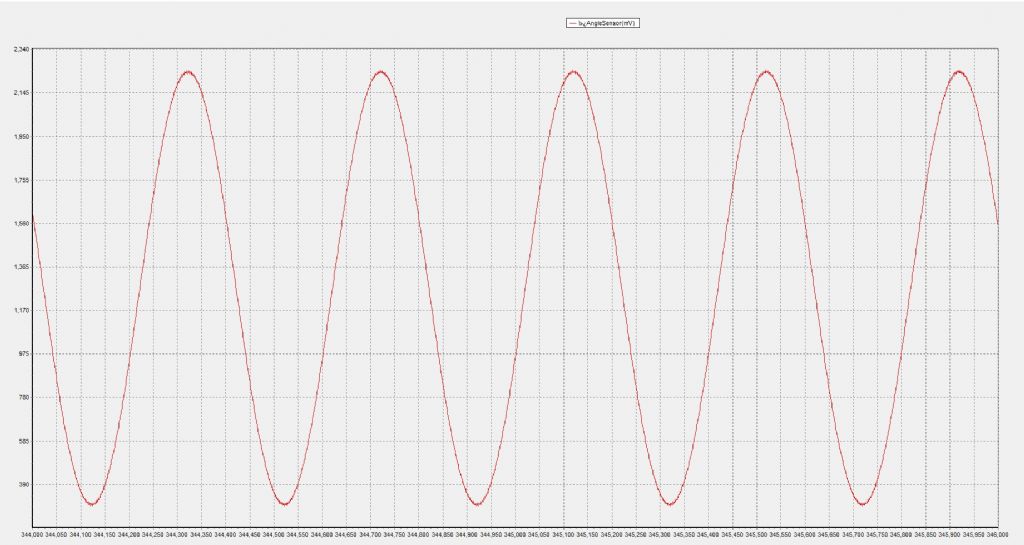
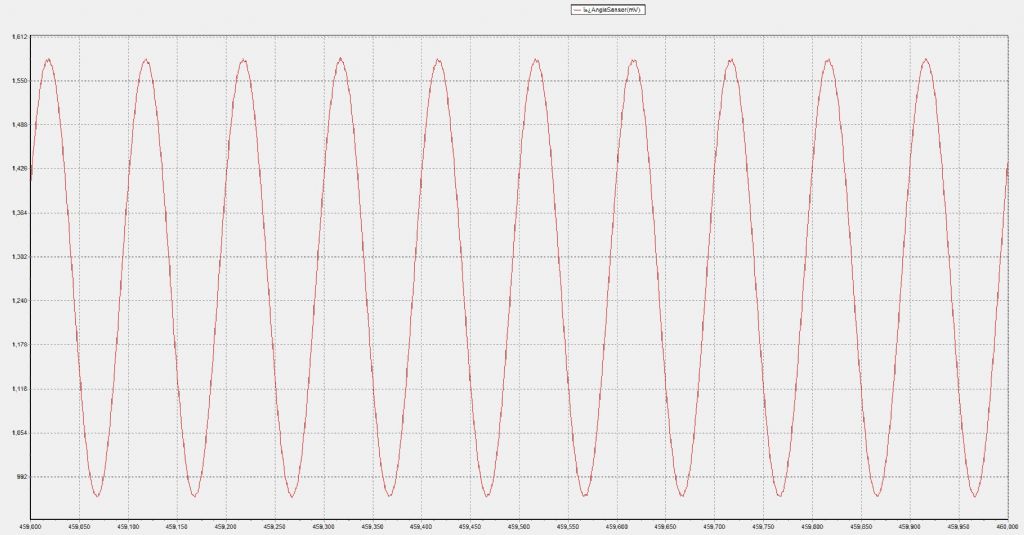
The sine wave from the angle sensor looks good, sampled at 200Hz. The sample artifacts at 50 Hz are quite clear in the posted examples below. The 200Hz sampled waveform will be used to generate the digital 90deg phase shift to the coil drive, in due course.
200Hz sampling and logging
50Hz Sampling
With the 'knife-edge' pivot and efforts I put in on the Bob format, etc, I would have thought I should achieve a better Q than it appears, although my expectations are/were biased by what others have been saying they have achieved – I will placate myself somewhat in the belief that the Q figures bandied about have been very much over-estimated in light of the recent discussions on ways to calculate Q and methods to do so.. I think the method I used is definitive and is very repeatable and should enable quantitative evaluating of the effects of modifications and alterations to the system.
Edited By Joseph Noci 1 on 29/08/2023 22:53:20
30 August 2023 at 07:14 #658447Joseph Noci 1
Participant@josephnoci1Incorrect use of words…
This plot is 2-1/2 hours of data at 50Hz. The data was analysed at the points where the amplitude had fallen [by]:
61% – Q = 12000
50% – Q = 12400
31.8% Q = 14514
Meant to say :
This plot is 2-1/2 hours of data at 50Hz. The data was analysed at the points where the amplitude had fallen [to]:
30 August 2023 at 07:17 #658448 Michael GilliganParticipant@michaelgilligan61133
That looks like ‘text book’ stuff, Jo
… you will likely be a cited reference for future investigators
MichaelG.
30 August 2023 at 08:42 #658455Joseph Noci 1
Participant@josephnoci1Thank You, Michael.
However, I am at the limit of my bounds on this – I don't know what to do next – so putting the Pendulum to sleep for a while!
30 August 2023 at 09:05 #658457 Michael GilliganParticipant@michaelgilligan61133
Please don’t let it sleep until you have tested with different start angles, Jo
You have a rig which obviously works and there is a wealth of information to be discovered
… just grab more data for now !!
MichaelG.
.
.
Footnote:
Data become information when we understand them.
Edited By Michael Gilligan on 30/08/2023 09:07:48
30 August 2023 at 09:38 #658462SillyOldDuffer
Moderator@sillyolddufferPosted by Joseph Noci 1 on 29/08/2023 22:45:40:Did a few runs today and logged data to calculate Q – Not impressive, but I think definitive.
…
This plot is 2-1/2 hours of data at 50Hz. The data was analysed at the points where the amplitude had fallen by:
61% – Q = 12000
50% – Q = 12400
31.8% Q = 14514
50Hz data log of pendulum sinusoid amplitude over time:
It is interesting that the Q increases with extended run-time. The amplitude of the swing at the start was 2deg full swing – Q seems to increase usefully with reduced swing angle. I will try another run with a 1.5deg full swing angle from the start to see if this is so.
…
With the 'knife-edge' pivot and efforts I put in on the Bob format, etc, I would have thought I should achieve a better Q than it appears, although my expectations are/were biased by what others have been saying they have achieved – I will placate myself somewhat in the belief that the Q figures bandied about have been very much over-estimated in light of the recent discussions on ways to calculate Q and methods to do so.. I think the method I used is definitive and is very repeatable and should enable quantitative evaluating of the effects of modifications and alterations to the system.
…
Excellent!
Though I too would have expected a higher number, the Q-factor is 'about right'. That said, it suggests something can be improved, as does the way Q increases as the pendulum decays.
The Q-factor calculation assumes a particular exponential decay, which may not be achieved in practice. Check the graph's curve to see how close the curve is to theoretical. Could be the Q is higher. (I can't look up the maths now – have to go out.)
I'd start by suspecting the suspension. What could possibly go wrong with a knife pivot? Could be the edge is rounded – not a point or a circle, or it slips sideways at high amplitudes, or is cutting a groove. Might be a 'running in' fault that diminishes as the edge wears into a comfy shape.
Next suspect is the bob shape because air resistance increases with speed. Although the rugby football shape should perform well, maybe it's construction edges or curves cause excessive turbulence. A smoking joss-stick might provide a clue.
Dave
Edited By SillyOldDuffer on 30/08/2023 09:39:46
30 August 2023 at 10:36 #658466Joseph Noci 1
Participant@josephnoci1Posted by SillyOldDuffer on 30/08/2023 09:38:35:.The Q-factor calculation assumes a particular exponential decay, which may not be achieved in practice. Check the graph's curve to see how close the curve is to theoretical. Could be the Q is higher. (I can't look up the maths now – have to go out.)
Would appreciate a reference to that exponential decay assumption – I have not come across any reference to that phenomena yet.
I'd start by suspecting the suspension. What could possibly go wrong with a knife pivot? Could be the edge is rounded – not a point or a circle, or it slips sideways at high amplitudes, or is cutting a groove. Might be a 'running in' fault that diminishes as the edge wears into a comfy shape.
I am confident as to sharpness of the knife edge – It was verified under a microscope before inserting the cobalt square into the pivot position, and whenever I move the pendulum, or work on the bob, I have two in-place aluminium blocks that screw to the head and that hold the cobalt square firmly in place, centered in the ball race inner, and not touching, so there is never any jarring, scraping or general banging about of the knife edge on the bearing inner race. The edge rides on the hard inner race – which was very well centered, parallel and square, so that knife edge and riding surface is good, I believe.
Next suspect is the bob shape because air resistance increases with speed. Although the rugby football shape should perform well, maybe it's construction edges or curves cause excessive turbulence. A smoking joss-stick might provide a clue.
Whatever the possible turbulence on this bob shape, it simulates better than any cylinder or ball shape, so if folk are really achieving Q's greater than my setup, with spring pivots and such like, then I suspect it was not Joss Sticks being smoked…
Dave
30 August 2023 at 14:27 #658502S K
Participant@sk20060Posted by Joseph Noci 1 on 29/08/2023 22:45:40:
61% – Q = 12000
50% – Q = 12400
31.8% Q = 14514
In case there's any remaining confusion about how to calculate Q with this sort of run-down test, maybe you should state how you calculated it at each interval.
(It's not surprising that Q improves with lower amplitudes due to lower losses from air resistance per swing. Also, knife edges are cool and may be a bit superior to spring hinges, but air friction almost completely dominates Q at normal atmospheric pressure, as seen by the dramatic improvements in Q in a vacuum.)
Your work is an amazing effort!
30 August 2023 at 14:45 #658505SillyOldDuffer
Moderator@sillyolddufferPosted by Joseph Noci 1 on 30/08/2023 10:36:42:Posted by SillyOldDuffer on 30/08/2023 09:38:35:
…
Whatever the possible turbulence on this bob shape, it simulates better than any cylinder or ball shape, so if folk are really achieving Q's greater than my setup, with spring pivots and such like, then I suspect it was not Joss Sticks being smoked…
Dave
If only!

Seriously though, I'd expect your pendulum to do better than 12000. The build quality is high, the measurement method seems sound (best amplitude measurement yet), and the graph looks right.
Other possibilities: swinging in a draught; frame flexing; floor not solid; suspension not level; elliptical path; external vibration; rod bending…
I've found pendulums to be very sensitive to tiny faults.
Dave
30 August 2023 at 16:26 #658519Joseph Noci 1
Participant@josephnoci1Dave:
I have made best effort to ensure the pendulum is in a stable system. Floor is 16 inches of concrete. The pendulum frame is very stiff and the A frames were welded at the base under sprung stress, so the frame is quite rigid – 20mm x1.5mm wall square tube, with a heavy base.
No draughts during the tests, all leveled up as best I can – Not sure how the rod could bend – only if there were resistance to pivot?
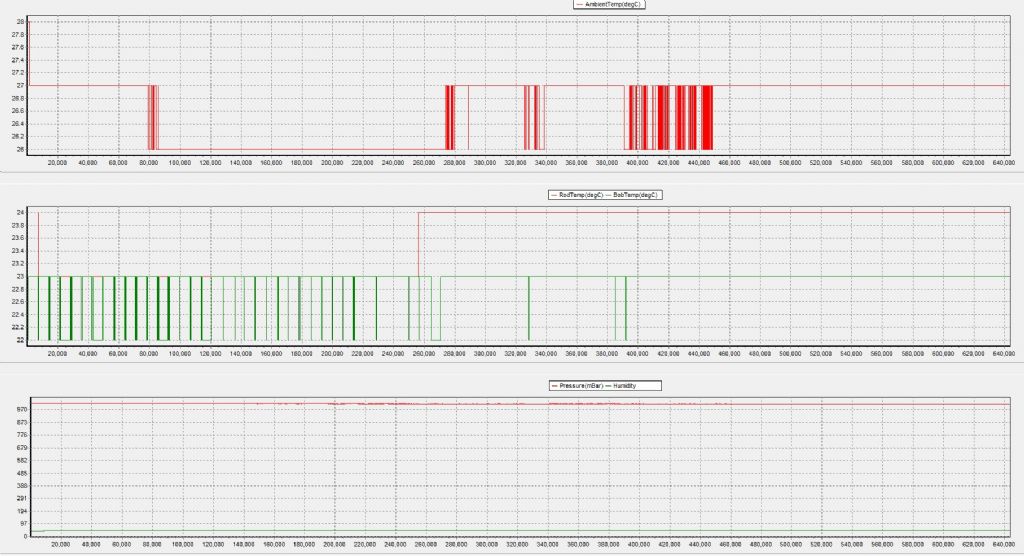
Temperatures, pressure, etc were very constant.
Ambient temp – 26-27deg, Rod : 23-24deg, Bob:22-23deg, Pressure 1014.4mb, Humidity – 44%
The Q's reported in the previous post have an error in the '31.8%' Q computation ( the Q of 14514)
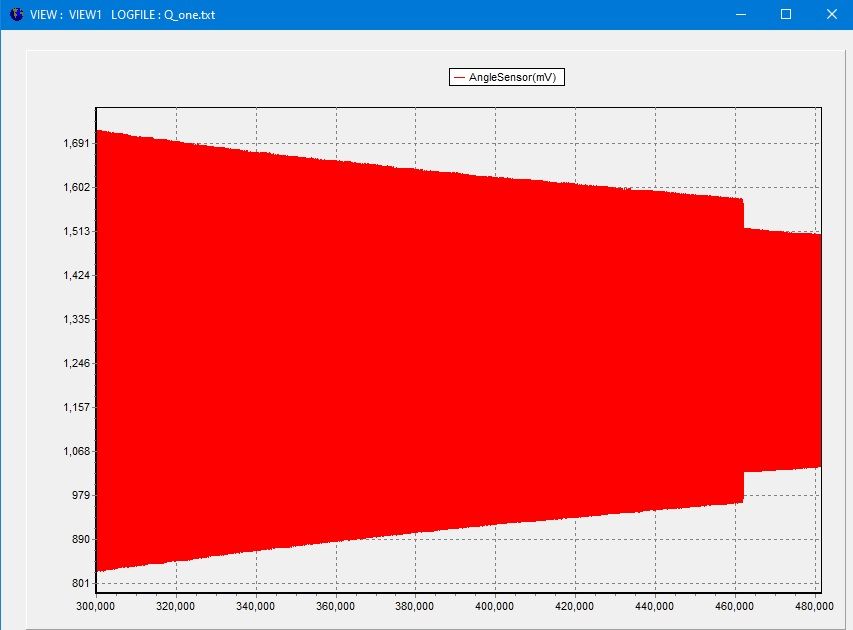
The logged data is a large file, and during the latter portions of that log, 'someone' must have bumped the pendulum and buried in the data I found this:
That jump up in Q was to suspicious and when digging minute by minute in the file I found what had happened, so that Q computation is invalid.
I ran the test again today – twice, with consistent results both times , using all the variations of Q computations already discussed :
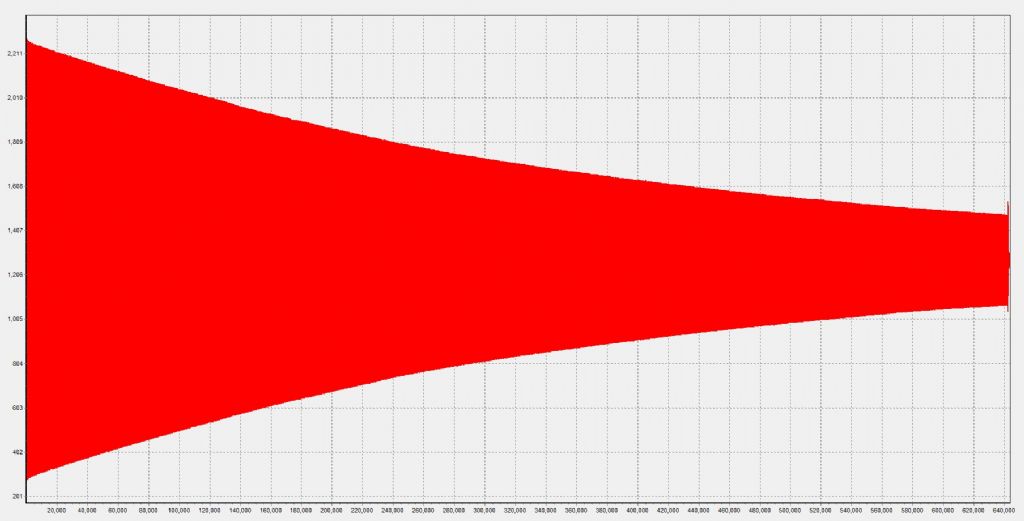
This is the plot of the last run-
It ran for 3hours 33minutes, with sample rate @ 20ms.
Q's computed :
@ 61% – 1940 beats * 2 * pi – Q = 12200
@ 50% – 2850 beats *4.5324 – Q = 12900
@ 36% – 4100 beats * pi Q = 12880
@ 21% – 6313 beats * 2.013 Q = 12714
There is a small improvement in Q from the 50% amplitude reduction onwards, and not what was indicated in the erroneous post. This is encouraging as it does indicate that the aerodynamic effects are not hugely impacting the bob, since there is little improvement at the lower amplitudes ( less moving air mass, but not a great Q improvement).
As more data becomes available for analysis, more improvements are made, and the cycle repeated…I have now discovered an oscillation in the stable system condition( pendulum running with amplitude loop locked) – logging the angle sensor data shows a variation of the peaks of the 0.5Hz period. It is very small – the peak to peak voltage is 1944mv, and the oscillation is 4mv. The peak angle is 1deg, so around 1000mv/deg. 4mV = 4milli degrees!
The total control loop time constant is around 60minutes, so it seems impossible that the pendulum is being forced to oscillate like this.
I do suspect it has to do with aliasing during the sampling of the voltage by the DAC.
When I sample at 200Hz (5ms), the oscillation period is 12 seconds ; at 20ms sample rate ( 50Hz) the period is 15 seconds – I suspect a software sampling cycle that is being interrupted by serial comms at a rate that causes a repeating delta in the sampling rate, and that manifests as an aliase…What fun.
30 August 2023 at 17:44 #658525SillyOldDuffer
Moderator@sillyolddufferPosted by Joseph Noci 1 on 30/08/2023 16:26:28:Dave:
I have made best effort to ensure the pendulum is in a stable system. Floor is 16 inches of concrete. The pendulum frame is very stiff and the A frames were welded at the base under sprung stress, so the frame is quite rigid – 20mm x1.5mm wall square tube, with a heavy base.
No draughts during the tests, all leveled up as best I can – Not sure how the rod could bend – only if there were resistance to pivot?
Temperatures, pressure, etc were very constant.
Ambient temp – 26-27deg, Rod : 23-24deg, Bob:22-23deg, Pressure 1014.4mb, Humidity – 44%
The Q's reported in the previous post have an error in the '31.8%' Q computation ( the Q of 14514)
The logged data is a large file, and during the latter portions of that log, 'someone' must have bumped the pendulum and buried in the data I found this:
That jump up in Q was to suspicious and when digging minute by minute in the file I found what had happened, so that Q computation is invalid.
I ran the test again today – twice, with consistent results both times , using all the variations of Q computations already discussed :
This is the plot of the last run-
It ran for 3hours 33minutes, with sample rate @ 20ms.
Q's computed :
@ 61% – 1940 beats * 2 * pi – Q = 12200
@ 50% – 2850 beats *4.5324 – Q = 12900
@ 36% – 4100 beats * pi Q = 12880
@ 21% – 6313 beats * 2.013 Q = 12714
There is a small improvement in Q from the 50% amplitude reduction onwards, and not what was indicated in the erroneous post. This is encouraging as it does indicate that the aerodynamic effects are not hugely impacting the bob, since there is little improvement at the lower amplitudes ( less moving air mass, but not a great Q improvement).
As more data becomes available for analysis, more improvements are made, and the cycle repeated…I have now discovered an oscillation in the stable system condition( pendulum running with amplitude loop locked) – logging the angle sensor data shows a variation of the peaks of the 0.5Hz period. It is very small – the peak to peak voltage is 1944mv, and the oscillation is 4mv. The peak angle is 1deg, so around 1000mv/deg. 4mV = 4milli degrees!
The total control loop time constant is around 60minutes, so it seems impossible that the pendulum is being forced to oscillate like this.
I do suspect it has to do with aliasing during the sampling of the voltage by the DAC.
When I sample at 200Hz (5ms), the oscillation period is 12 seconds ; at 20ms sample rate ( 50Hz) the period is 15 seconds – I suspect a software sampling cycle that is being interrupted by serial comms at a rate that causes a repeating delta in the sampling rate, and that manifests as an aliase…What fun.
Fascinating. I love this stuff.
Graphing, zooming in and doing the statistics revealed many anomalies in the data collected by my Mark 1 pendulum, which had many mechanical and electronic shortcomings compared with yours. Though the latest build is better made, I'm still getting odd patterns and events, especially over long runs. For example, seems the Q-factor of my pendulum varies significantly during runs. May be my methodology is faulty – forum peers haven't approved my way of measuring Q.
I sample every beat, about 0.933s and after 46 days the log file is up to 370Mb. Loaded for statistical analysis into my computer, a 370Mb input file eats nearly 4Gb of RAM. A 20 millisecond sample rate is scary.
Dave
30 August 2023 at 19:04 #658537Joseph Noci 1
Participant@josephnoci1Data analysis is an Art itself. The size of the file and how much space it needs in RAM is no longer an issue these days, but I have yet to find Non-Rockefeller SW tools able to process such large files without needing a shave between runs!
The core sample rate of the ADC data for the angle sensor is 200Hz ( 5ms) – because I eventually want to use that to generate the phase offset for the coil drive, and to be able to adjust the phase in small angles – maybe 0.1deg or better. The Temps/pressure, etc I sample at 2sec intervals, and will probably push that out to 30sec.
You do seem reluctant to stem the Q tide against you – is it not practical on your setup to do a 'normal' run-down data log?
30 August 2023 at 19:43 #658548 Michael GilliganParticipant@michaelgilligan61133Posted by Joseph Noci 1 on 30/08/2023 10:36:42:Posted by SillyOldDuffer on 30/08/2023 09:38:35:.
The Q-factor calculation assumes a particular exponential decay, which may not be achieved in practice. Check the graph's curve to see how close the curve is to theoretical. Could be the Q is higher. (I can't look up the maths now – have to go out.)
Would appreciate a reference to that exponential decay assumption – I have not come across any reference to that phenomena yet.
[…]
.
At the risk of putting my foot into it [ I have already lost track of whom I am quoting]
The exponential decay is quite well described in something I recently referenced:
https://www.model-engineer.co.uk/forums/postings.asp?th=187595&p=4
.
[quote]
Edit: __ in the case for the prosecution, I present this [found after I posted] well-documented, and easily replicated, experiment: **LINK**
Edited By Michael Gilligan on 18/08/2023 20:32:22
[/quote]
.
MichaelG.
Edited By Michael Gilligan on 30/08/2023 19:45:57
30 August 2023 at 20:02 #658553SillyOldDuffer
Moderator@sillyolddufferPosted by Joseph Noci 1 on 30/08/2023 19:04:03:
…
You do seem reluctant to stem the Q tide against you – is it not practical on your setup to do a 'normal' run-down data log?
Partly other things to worry about, partly measuring Q isn't vital to my project, partly I'm not quite fully convinced I'm doing it wrong yet, partly because I don't want to stop the current test run, plus a technical issue to solve.
My electronics produce a relative measure of amplitude, so in theory I could simply change the governor values so the pendulum is never impulsed, which can be done by remote control.
Unfortunately, SK questioning IR sensor performance led me to check how well my cheap Arduino comparator performs. It's good on beam-break detect, but the beam-open detect timing is delayed. Thus my relative amplitude value is wrong, possibly by a constant, not confirmed. Doesn't affect clock operation, but it means the decay curve can't be trusted. Unhelpfully, my amplitude measure is low resolution because the code clips the logged amplitude value to 4 places of decimals to save space. Needs a recompile and install to fix.
Often wish I'd built two clocks, one for long test runs and the second for testing new ideas on. As it is, I don't want to touch the clock until the present test comes to an end. Been running for 43days, 22 hours. During that time I've not been able to apply any hardware or software upgrades. At the moment the clock is 6.297933s slow.
Looking at the data I'm 99% certain there's an error in the way I calculate temperature/pressure compensation, cause unknown. And a suspicion the Arduino applying compensation with single precision floating point numbers is losing accuracy.
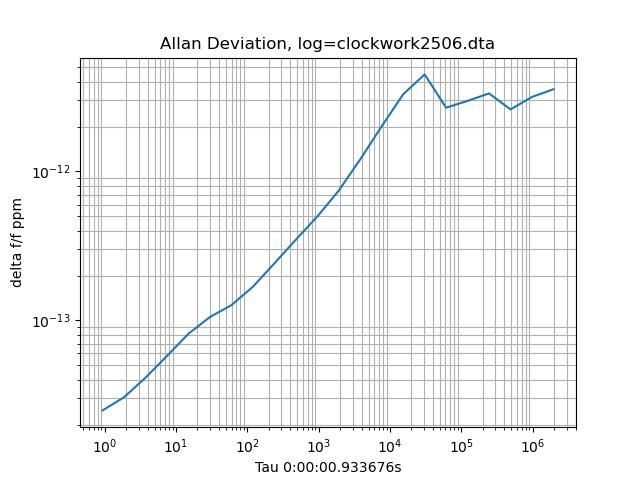
Just for laughs here's the Allan Deviation.
If I drew the graph correctly and understand Rawlings/Bateman it means 'Progressive change ins system parameters' with 'Normal type of rate fluctuation. Could be horribly wrong – I don't have the right sort of brain for maths and statistics!
Dave
30 August 2023 at 21:54 #658567Joseph Noci 1
Participant@josephnoci1Posted by Michael Gilligan on 30/08/2023 19:43:12:At the risk of putting my foot into it [ I have already lost track of whom I am quoting]
The exponential decay is quite well described in something I recently referenced:
Edit: __ in the case for the prosecution, I present this [found after I posted] well-documented, and easily replicated, experiment: **LINK**
MichaelG.
Thanks Michael – I read through briefly and will try study in depth, as I still do not follow – I understand the exponential decay – that applies to all oscillators, so in the realm of electronic oscillators, with transistors and coils and capacitors, I am comfortable in predicting and calculating the curve for a set of parts – But I am lost with the pendulum. I don't see how to compute the exponential decay without either knowing Q ( and then I have the decay anyway) or a plethora of other data – pivot friction, air resistance to the bob/rod, etc – all damping factors that would change the curve.
30 August 2023 at 22:06 #658569Joseph Noci 1
Participant@josephnoci1Posted by SillyOldDuffer on 30/08/2023 20:02:58:At the moment the clock is 6.297933s slow.
Just for laughs here's the Allan Deviation.
Dave
6sec in 44 days is rather impressive – 1.6us/sec slow….Not sure my approach will be as good.
Dave, that ADEV graph bothers me – it is shown reversed to the norm, ie, starts hi and drops, stabilises and then turns up again. Also, way down below 10 minus 13…! That's good GPSDO territory and I am afraid, not possible. Even the Shortt is around 10 minus 8 @ 10 ^5 sec.
Unless I misunderstand this curve completely, is looks like the curve you get when you do ADEV measurement on an oscillator using a time reference that is derived from the same oscillator – somewhat incestuous…doing so gives a curve that just keeps going down, almost forever – looks good, but is a lie.
EDIT : is your pendulum running in a vacuum on this test?
Edited By Joseph Noci 1 on 30/08/2023 22:08:31
30 August 2023 at 22:25 #658571 Michael GilliganParticipant@michaelgilligan61133
Posted by Joseph Noci 1 on 30/08/2023 21:54:54:
.
[…]
But I am lost with the pendulum. I don't see how to compute the exponential decay without either knowing Q ( and then I have the decay anyway) or a plethora of other data – pivot friction, air resistance to the bob/rod, etc – all damping factors that would change the curve.
.
I think you may already be ‘ahead of the game’ Jo
The recent papers I have found cover fairly simple experimental set-ups, and are pretty-much ‘demonstration of concept’ exercises … I wonder whether there is actually any current ‘Academic research’ on pendulums, or whether they are considered passé
MichaelG.
31 August 2023 at 04:10 #658582 Michael GilliganParticipant@michaelgilligan61133
 Dynamic analysis of simple pendulum model under variable damping
This is recent, and freely downloadable: **LINK**
https://www.sciencedirect.com/science/article/pii/S1110016822002393
.
MichaelG.
31 August 2023 at 07:14 #658586John Haine
Participant@johnhaine32865Well, a few points.
First Joe, I think your Q is very respectable. Of the same order that a Synchronome has if not having to operate its count wheel. My 'Nome derivative is about 12,000, and Doug Bateman's clock is similar.
Looking back through this thread I don't see a mention of your bob mass. Q is defined in the simple model as "w*M/k" where w is angular resonant frequency, M the mass, and k the resistance constant. Your shape will have a lower k but mass is equally important.
Nome bobs are usually about 7kg (as is mine being a hefty chunk of CI). They are however blunt cylinders so aerodynamically not so good. If you can increase your bob density (fill it or make it from lead?) that should be a direct was to get higher Q. My tungsten bob is somewhat smaller in mass (5.2kg) but 52mm diameter rather than 80mm, and has chamfered and rounded ends. I think its relatively smaller size and high density is what gives it the higher Q.
You plot the decay I think on a linear amplitude scale. It would be interesting to plot it on a log (ln) scale which is more natural for exponential decay. But it's fairly clear that there is a "break point" where the slope decreases. If you are seeing essentially an exponential shape it's a good indication that the loss is primarily aerodynamic – other forms of loss give different shapes. My pendulum test showed exactly such a break point, with a somewhat higher Q for that part of the decay above it. At very low speeds the loss is viscous drag which is proportional to velocity and gives the "ideal" decay shape. As amplitude increases the flow gets more complex and the loss moves towards a square-law with velocity. Douglas Drumheller in the US does a lot of work in this area and you can see some discussion at here. (By the way please feel free to join the HSN forum!) In an HSN article IIRC, Doug links this towards flow vortices detaching from the bob at higher speeds.
-
AuthorPosts
- Please log in to reply to this topic. Registering is free and easy using the links on the menu at the top of this page.
Latest Replies
Home › Forums › Clocks and Scientific Instruments › Topics
-
- Topic
- Voices
- Posts
- Last Post
-
-
Indicators – vehicle
Started by:
Speedy Builder5 in: Electronics in the Workshop
- 2
- 3
-
13 July 2025 at 17:00
Speedy Builder5
-
Silver steel crankshaft
Started by:
teamricky in: Stationary engines
- 6
- 12
-
13 July 2025 at 16:03
 JasonB
-
Variable DC power supply?
Started by:
Andrew Tinsley in: Electronics in the Workshop
- 1
- 1
-
13 July 2025 at 15:52
Andrew Tinsley
-
Adjustable spanner thread direction
Started by:
 jimmy b
in: Workshop Tools and Tooling
- 9
- 9
-
13 July 2025 at 15:45
Martin Kyte
-
Boiler Design – issue 4765
1
2
…
7
8
Started by:
Charles Lamont in: Model Engineer & Workshop
- 26
- 195
-
13 July 2025 at 13:59
 JasonB
-
Another Day … Another ScumBag
1
2
Started by:
 Michael Gilligan
in: The Tea Room
- 15
- 32
-
13 July 2025 at 13:52
 Robert Atkinson 2
-
Electroplating questions
Started by:
Baldric in: Help and Assistance! (Offered or Wanted)
- 3
- 3
-
13 July 2025 at 13:42
noel shelley
-
TurboCAD – Alibre File Transfers.
Started by:
Nigel Graham 2 in: CAD – Technical drawing & design
- 5
- 15
-
13 July 2025 at 13:26
 JasonB
-
Sat nag
1
2
Started by:
duncan webster 1 in: The Tea Room
- 17
- 35
-
13 July 2025 at 12:20
SillyOldDuffer
-
buying machine tools from aliexpress experiences?
Started by:
Jake Middleton-Metcalfe in: Manual machine tools
- 15
- 19
-
13 July 2025 at 09:57
 Russell Eberhardt
-
“swedish iron”
Started by:
moonman in: Materials
- 11
- 15
-
13 July 2025 at 09:47
Martin Kyte
-
Difficulty in sourceing 2.5mm s/s ‘Full’ nuts
Started by:
Greensands in: General Questions
- 7
- 12
-
13 July 2025 at 09:22
Roger Woollett
-
Rotary valve engine
Started by:
AStroud in: Stationary engines
- 2
- 3
-
13 July 2025 at 08:49
AStroud
-
Sanjay’s Banjo Engine
Started by:
 JasonB
in: Stationary engines
- 3
- 12
-
13 July 2025 at 06:50
Diogenes
-
I’m Under Pressure
1
2
Started by:
howardb in: Related Hobbies including Vehicle Restoration
- 17
- 31
-
12 July 2025 at 22:00
Howard Lewis
-
Help for DIY lathe build.
1
2
Started by:
moogie in: Help and Assistance! (Offered or Wanted)
- 16
- 36
-
12 July 2025 at 21:42
Howard Lewis
-
Electronic leadscrew pitching error
Started by:
paulg 1 in: Introduce Yourself – New members start here!
- 2
- 6
-
12 July 2025 at 21:08
paulg 1
-
New Member From The Isle of Man
Started by:
sprocket 3 in: Introduce Yourself – New members start here!
- 4
- 4
-
12 July 2025 at 20:57
Howard Lewis
-
Farm Boy
1
2
…
4
5
Started by:
Dalboy in: I/C Engines
- 15
- 103
-
12 July 2025 at 18:51
Dalboy
-
The Silver Swan Automaton
Started by:
James A in: Related Hobbies including Vehicle Restoration
- 3
- 5
-
12 July 2025 at 18:46
James A
-
Model Turbines
1
2
…
24
25
Started by:
Turbine Guy in: Stationary engines
- 28
- 607
-
12 July 2025 at 16:28
Turbine Guy
-
Nozzle dot dwg
Started by:
 Michael Gilligan
in: CAD – Technical drawing & design
- 1
- 1
-
12 July 2025 at 14:47
 Michael Gilligan
-
Yet another scam
Started by:
 Dell
in: The Tea Room
- 2
- 2
-
12 July 2025 at 10:16
Bo’sun
-
Chester Champion, warco ZX15 drawbar
Started by:
martian in: Manual machine tools
- 5
- 7
-
11 July 2025 at 21:51
Howard Lewis
-
Bosch PBD 40 bearing upgrade
Started by:
th1980 in: Manual machine tools
- 6
- 12
-
11 July 2025 at 21:33
Howard Lewis
-
Indicators – vehicle
-


