Experimental Pendulum Clock

Advert

Experimental Pendulum Clock

Home Forums Clocks and Scientific Instruments Experimental Pendulum Clock

Viewing 12 posts - 551 through 562 (of 562 total)
  • Author
    Posts
  • #634429
    John Haine
    Participant
      @johnhaine32865

      Dave, sorry I didn't reply directly to your example but I was just using my phone, not ideal for detailed typing!

      Taking your array of period errors, supposing the were just…

      e1, e2, e3, e4, e5, ……

      then supposing a clock that started at zero in the period just before e1, form the sequence:

      0, 0+e1, 0+e2+e2, 0+e1+e2+e3, ….

      where each term is the previous one plus the new error. This sequence would be the time, or phase, error of the clock from perfect time. This is the sequence to compute ADEV from.

      Of course what we are actually doing here is starting with the sequence of periods which are themselves derived by differencing successive event timer values. Mechanical clockmakers think in terms of period since that's what is dependent on pressure, temperature etc. But it might be better to just capture the event timer values and do it the other way found, deriving the periods when needed to determine correlations with environmental variables. For long runs the amount of data gets bigger of course.

      Advert
      #634439
      SillyOldDuffer
      Moderator
        @sillyoldduffer
        Posted by John Haine on 21/02/2023 07:21:33:

        Dave, sorry I didn't reply directly to your example but I was just using my phone, not ideal for detailed typing!

        Taking your array of period errors, supposing the were just…

        e1, e2, e3, e4, e5, ……

        then supposing a clock that started at zero in the period just before e1, form the sequence:

        0, 0+e1, 0+e2+e2, 0+e1+e2+e3, ….

        where each term is the previous one plus the new error. This sequence would be the time, or phase, error of the clock from perfect time. This is the sequence to compute ADEV from.

        Excellent thanks, I understand!

        A rolling sum exactly as you said in the first place, sorry it didn't click. Off to try it now.

        Ta,

        Dave

        #634470
        SillyOldDuffer
        Moderator
          @sillyoldduffer
          Posted by SillyOldDuffer on 21/02/2023 08:56:49:

          Posted by John Haine on 21/02/2023 07:21:33:…

          then supposing a clock that started at zero in the period just before e1, form the sequence:

          0, 0+e1, 0+e2+e2, 0+e1+e2+e3, ….

          where each term is the previous one plus the new error. This sequence would be the time, or phase, error of the clock from perfect time. This is the sequence to compute ADEV from.

          Excellent thanks, I understand!

          A rolling sum exactly as you said in the first place, sorry it didn't click. Off to try it now.

          Ta,

          Dave

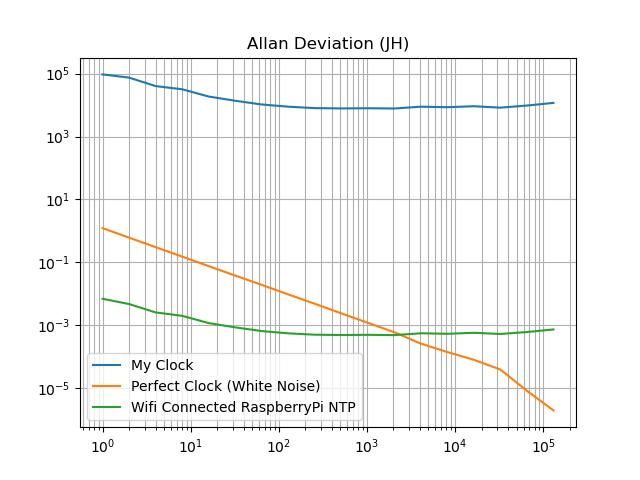
          Would have reported earlier except I added a 'perfect clock' and 'Raspberry Pi NTP' for comparison:

          2102allanjh.jpg

          Interpreting this, I offer:

          • The direction of slope is as important as position on the Y-scale (Allan Deviations), but
          • good clocks have lower Allan Deviation values than bad ones, also
          • The X-Scale (measurement intervals, taus), should be read left to right in 5 sectors:
            • White Phase Noise (unavoidable in any system)
            • Phase Flicker Noise
            • White Frequency Noise
            • Frequency Flicker Noise (mechanical issues)
            • Random Walk Noise (caused by an environmental change triggering a temporary variation in rate)

          My feeling is noise is only significant in really good clocks, that is the graph helps diagnose problems once a clock has been thoroughly debugged. Gross errors, like the suspension working loose, don't need Allan Variance to diagnose the fault. I think Allan is useful when there's a desire to improve an already good clock.

          So, not unexpectedly my clock is well up the deviation scale (lots of noise), and the flat line line indicates that the main problem is Frequency Modulated Flicker, where the clock's rate is constantly disturbed.

          The 'Perfect Clock' is represented by White Noise, in which there is no Flicker or Random Walk noise. It's slope marches down at about -0.5.

          The Green line is NTP as measured by my clock ticking a raspberryPi (which adds NTP timestamps). So the slope of the NTP line is dominated by my clock's Frequency Modulated flicker, but the superior stability of NTP shows up by the line being much lower down the Y-scale.

          GPS seconds are the closest I can get to a perfect clock, so I'll try NTP timestamping it's output, and running Allan on the result. I think that will give a reasonable measure of the Allan Variance of NTP on my raspberryPi. The variance should be low, but far from perfect.

          Won't take long but I have to out. A job for this evening.

          Does my explanation of Allan sound reasonable? I believe I'm gradually making sense of Rawlings, Chapter 18, but could be wrong.

          Dave

          #634499
          Michael Gilligan
          Participant
            @michaelgilligan61133

            Posted by SillyOldDuffer on 21/02/2023 13:03:32:

            […]

            2102allanjh.jpg

            Interpreting this, I offer:

            The 'Perfect Clock' is represented by White Noise, in which there is no Flicker or Random Walk noise. It's slope marches down at about -0.5.

            […]

            .

            A serious, but possibly daft, question if I may:

            Why is the line for ‘Perfect Clock’ not on a perfect slope, at exactly -0.5

            [ visually, I see two kinks … there might be more ]

            Not a dig at you, Dave … just an honest question for everyone to contemplate.

            MichaelG.

            #634582
            SillyOldDuffer
            Moderator
              @sillyoldduffer
              Posted by Michael Gilligan on 21/02/2023 15:41:26:

              Posted by SillyOldDuffer on 21/02/2023 13:03:32:

              […]

              2102allanjh.jpg

              Interpreting this, I offer:

              The 'Perfect Clock' is represented by White Noise, in which there is no Flicker or Random Walk noise. It's slope marches down at about -0.5.

              […]

              .

              A serious, but possibly daft, question if I may:

              Why is the line for ‘Perfect Clock’ not on a perfect slope, at exactly -0.5

              [ visually, I see two kinks … there might be more ]

              Not a dig at you, Dave … just an honest question for everyone to contemplate.

              MichaelG.

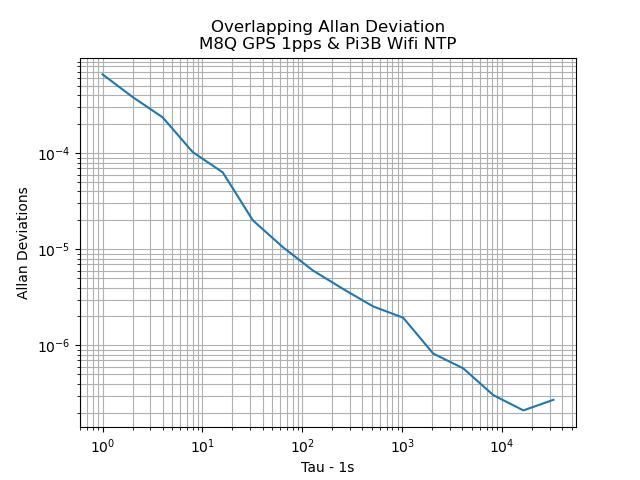
              I don't know for sure, but I think the end kink may be a statistical artefact. Graph below is GPS as measured by NTP. As expected, there's a nice -0.5 slope, but it also comes to a kinky end:

              2202allangpsntp.jpg

              As the data set is an array, it was easy to redraw the graph with the last 1000 samples chopped off. The kink remains, showing it's not caused by the end data, rather is a result of the analysis. I think the short up kink means: in this dataset, there is evidence of random walk FM, but not much.

              In the white noise 'Perfect Clock' graph, I think the short down kink means: in this dataset, there is evidence of errors of observation, but not much'

              The allantools module provides White, Brown, Violet and Pink noise sources, each representing a different type of clock behaviour. I'll try graphing them together to see if that helps my understanding. Don't bet the farm on it!

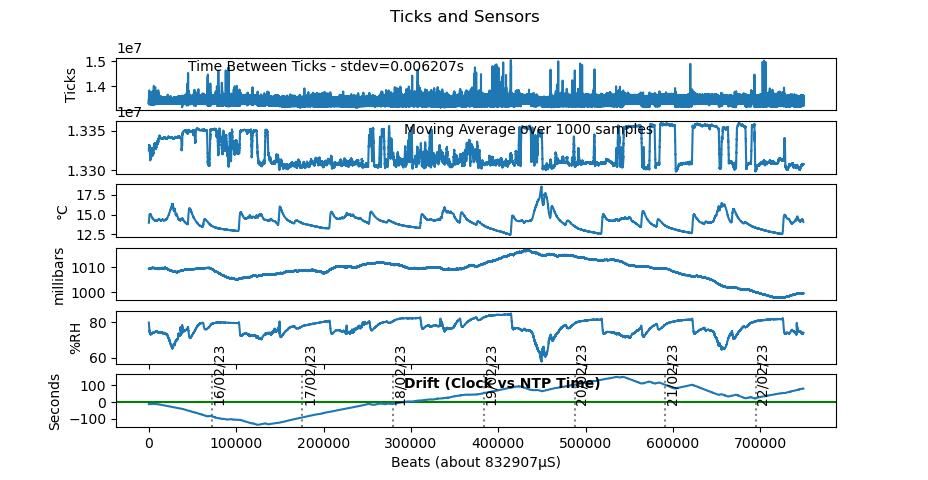
              Meanwhile, my clock is doing it's own thing whilst I sort other problems out. Seems it's keeping roughly correct time with a ±150 second wobble:

              2202drift.jpg

              I suspect my temperature and pressure compensation is wrong, probably over correcting pressure. Not had time to look at it properly – too much going on at once. Back to the OCXO next…

              Dave

              #634739
              SillyOldDuffer
              Moderator
                @sillyoldduffer

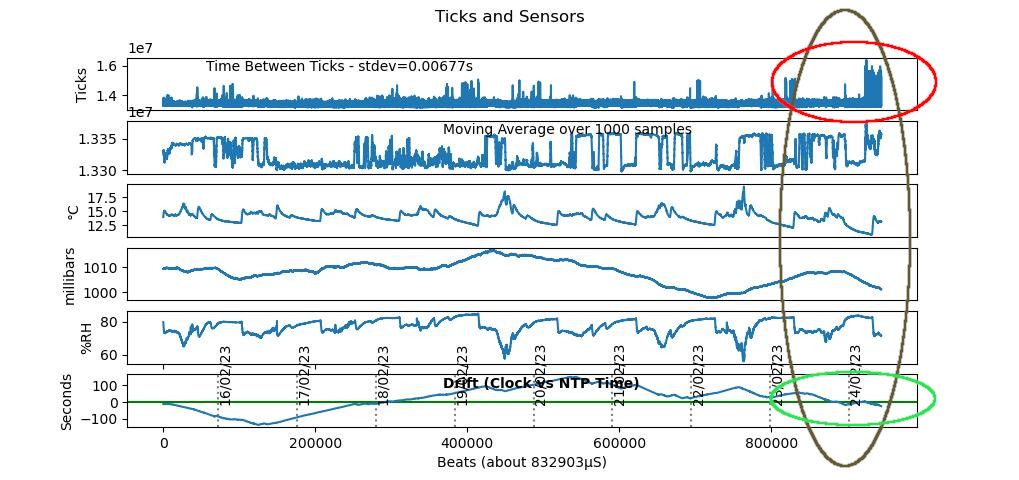
                This morning's graph shows both good and behaviour at the same time, which is bad:

                2402drift.jpeg

                When the log was downloaded, the clock was running close to the green horizontal line on the bottom graph ('Drift&#39. It's done particularly well over the last 14 hours, where it's kept good time (green ellipse). And overall, there's comfort in the whole trace not veering to one side of the line: on average it's not fast or slow.
                The top graph, period measured in 62,5nS ticks, tells a different story. It shows the clock is currently experiencing a bout of bad behaviour, which the log shows is due to an outbreak beam sensor misreads, about 1% count one beat twice.

                I urgently need to fix the mechanical clock! Would have started yesterday, except I've been diverted by unexpected Oven Controlled Crystal Oscillator (OCXO) problems, another tale of woe.

                Dave

                #634742
                Michael Gilligan
                Participant
                  @michaelgilligan61133

                  Apologies, Dave … I didn’t notice your reply on 22-Feb

                  [quote] As the data set is an array, it was easy to redraw the graph with the last 1000 samples chopped off. The kink remains, showing it's not caused by the end data, rather is a result of the analysis. [/quote]

                  dont know Interesting … Thanks

                  MichaelG.

                  #635279
                  SillyOldDuffer
                  Moderator
                    @sillyoldduffer

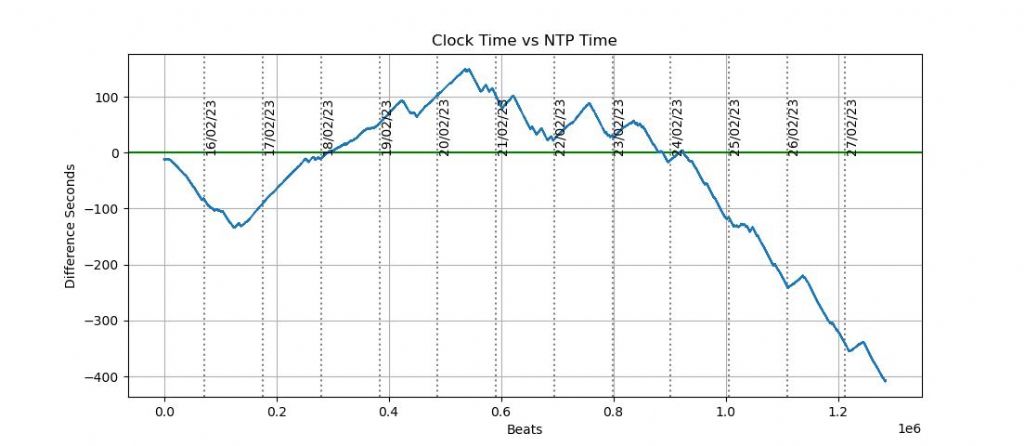
                    Final report on the clock before it's rebuilt! This afternoon's drift graph shows the pendulum has been losing time for four days, and is now 407 seconds slow after 12 days 9 hours (1,284,846 beats). Hardly a precision clock!

                    2702drift.jpeg

                    So I'm going to dismantle the clock next to my computer screen whilst I redesign the Mk 2. Although I have a partial CAD design of the original in F360, I'm going to start again with Solid Edge using the existing build to double check dimensions. The new version will fit into the same footprint unless I'm bent over a barrel and forced to make it bigger! I hope to re-use some of the bits.

                    Priorities are the suspension, the beam break system, and an adjustable carriage to support the sensors and electromagnet.

                    My statistics program and logging strategy need attention too. The current log is 165Mb, and processing it and producing the graphs consumes over a gigabyte of RAM, more than I expected. Not a problem yet, but a log covering a couple of months would be.

                    Performance isn't an issue: only 15 seconds from starting the program to printing all the statistics after crunching 15,418,152 floating point numbers. The graphs take a few seconds each. Anyone who fancies doing the same sums with paper and pencil is welcome to try!

                    Dave

                    #635285
                    John Haine
                    Participant
                      @johnhaine32865

                      Dave, if you are re-designing there's something I meant to mention earlier. If I'm correct you suspend the pendulum from a platform on 3 pillars, right? One of the issues of this is that the support horizontal compliance varies depending on the angle between the plane of swing and the pillars. Worse, I think that unless the force applied is along one of the vertical planes of symmetry passing through a leg, the strain (movement) produced by the stress (reaction force) exerted by the pendulum is not in the direction of the force. This could couple energy into other pendulum modes. A 4 legged support would work better, or make sure that the pendulum swings in one of the planes of symmetry.

                      #635299
                      SillyOldDuffer
                      Moderator
                        @sillyoldduffer
                        Posted by John Haine on 27/02/2023 18:30:13:

                        … A 4 legged support would work better…

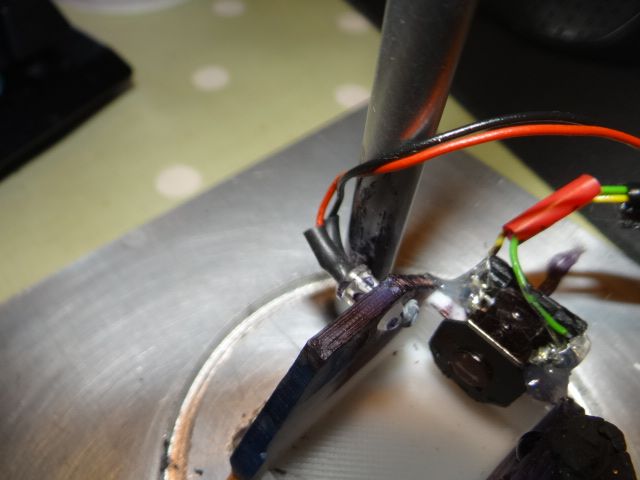
                        Must be telepathy, I was just thinking about pillars for a different reason, which is space. With the thing in bits, it's obvious the over-tight construction causes unnecessary bother.

                        dsc06681.jpg

                        Add your point and it makes sense to go for a 110mm drainpipe and 4 pillars, maybe more. I'll play with CAD to see what makes sense.

                        Be good to get the next build right – in addition to design flaws, the craftsmanship on the prototype is terrible, much worse than I remember.

                        Dave

                        #635301
                        Michael Gilligan
                        Participant
                          @michaelgilligan61133

                          Oh dear … As if Dave didn’t have enough challenges to face already

                          Now he needs to balance the conflicting requirements of

                          • Four pillars for symmetry and ease of access

                          with

                          • Three feet for kinematic stability

                          Be brave, Dave

                          MichaelG.

                          #635306
                          duncan webster 1
                          Participant
                            @duncanwebster1

                            Here's a challenge, both to 3D model and to make, a Shokov hyperboloid tower with the pendulum swinging in the middle. Very light but stiff. It could have 4 short legs at the base to allow access to magnets, sensors etc.

                            Edited By duncan webster on 27/02/2023 22:18:59

                          Viewing 12 posts - 551 through 562 (of 562 total)
                          • Please log in to reply to this topic. Registering is free and easy using the links on the menu at the top of this page.

                          Advert

                          Latest Replies

                          Viewing 25 topics - 1 through 25 (of 25 total)
                          Viewing 25 topics - 1 through 25 (of 25 total)

                          View full reply list.

                          Advert

                          Newsletter Sign-up