Experimental Pendulum Clock

Advert

Experimental Pendulum Clock

Home Forums Clocks and Scientific Instruments Experimental Pendulum Clock

Viewing 25 posts - 526 through 550 (of 562 total)
  • Author
    Posts
  • #634221
    Martin Kyte
    Participant
      @martinkyte99762

      This Allan variance unless I’ve missed something which is perfectly possible seems reasonably simple at least on a comprehension basis. It’s as cleverer people than me would know as the square of the variation in frequency in one sample period t minus the square of the variance in the next. Done many times the average homes in on a stable value. This is done with increasing values of t and the results plotted with Allan Variance against the sample period. So to my mind the graph then shows the ‘wobble factor’ or instability of the system at frequencies from high to low on the graph as sample period increases. Thus it is possible to visualise errors due to noise at the one end and drift at the other. Wikipedia actually seems to explain it quite well for once. Unless as I said I’m missing something.

      regards Martin

      Edited By Martin Kyte on 19/02/2023 17:20:51

      Advert
      #634223
      duncan webster 1
      Participant
        @duncanwebster1
        Posted by duncan webster on 17/02/2023 18:04:03:

        Having had a think, I can see why vacuum chamber is attractive, eliminates buoyancy, drag, etc issues. I wonder if the office junior's first and last job of the day was to check the level of vacuum and pump if necessary. And how did he check, a mercury barometer would be affected by ambient pressure, must have been aneroid.

        Gravity escapement a la synchronome gives equal impulse either side of centre, so will have less effect on period. If you had a split vane on the pendulum and a slotted opto with a magnet on the pendulum you could arrange similar with electrical drive, as the vane approaches and passes centre it goes on+, off, on-, off, so it is attracted towards centre and then pushed away

        Edited By duncan webster on 17/02/2023 18:06:16

        department of daft ideas time. If I fix a bit of DRO magnetic tape to the pendulum and mount a DRO read head, I can monitor where the pendulum is at all times, thus I know dead centre and amplitude without needing an accurate processor. I can then have my pushMe/pullYou impulsing and control amplitude, either on a hit and miss basis or proportional.

        Too many other irons in the fire, but food for thought

        #634225
        Joseph Noci 1
        Participant
          @josephnoci1

          But you need a fast processor – catching microns – and its in a serial message – will that keep up – some sums to do..

          You still need timing though – position won't integrate into rate or time…And time stamping the serial message data…

          Edited By Joseph Noci 1 on 19/02/2023 17:37:30

          #634228
          SillyOldDuffer
          Moderator
            @sillyoldduffer
            Posted by Martin Kyte on 19/02/2023 17:19:24:

            This Allan variance unless I’ve missed something which is perfectly possible seems reasonably simple at least on a comprehension basis…

            Some of us are lacking in the comprehension department!

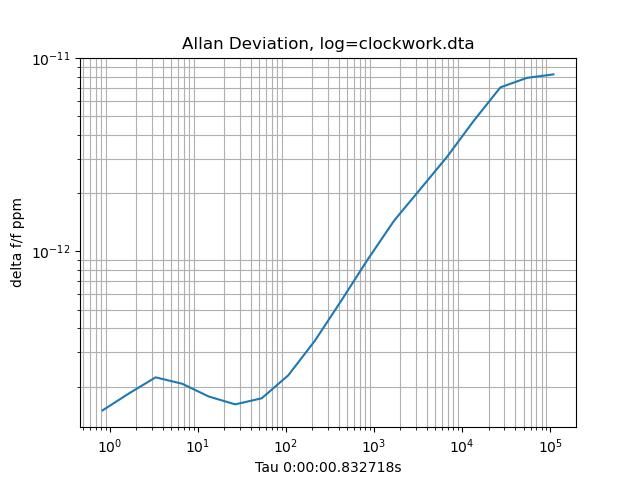
            This is the Allan Deviation for my clock, taken just now. It covers 460999 beats, (or 4 days, 10hours, 38minutes in real money.)

            1902allan.jpg

            Rawlings provides a table to help interpret the graph

            Gradient Cause
            -1.0 ……. Errors of observation
            -0.5 ……. White Noise (the ideal)
            0.0 ……. Normal Rate Fluctuation
            +0.5 …… Random Shifts in system parameters
            +1.0 …… Progressive change in system parameters

            My questions are:

            • Is my clock good or bad, and why
            • Why is the Y scale in the 10⁻¹² region, and what does it mean

            Please be gentle with me, my next project is a Dunce Cap.

            blush

            Dave

            #634231
            duncan webster 1
            Participant
              @duncanwebster1
              Posted by Joseph Noci 1 on 19/02/2023 17:35:44:

              But you need a fast processor – catching microns – and its in a serial message – will that keep up – some sums to do..

              You still need timing though – position won't integrate into rate or time…And time stamping the serial message data…

              Edited By Joseph Noci 1 on 19/02/2023 17:37:30

              It might need to be fast, but it doesn't need to be super stable. If it zeros a count before you start the pendulum, it can detect centre of swing (when the count changes sign) and output a pulse, this is nominally at 1 second intervals, but I've used my super stable accurate picPet type device to calibrate it. the output pulses do not rely on the processor's clock

              #634234
              Martin Kyte
              Participant
                @martinkyte99762

                My post not intended in any way to cast aspersions on anyone, particularly you Dave. I think you have just answered the question of ‘what am I missing’ which would be how do you interpret the graph to make meaningful sense of what’s going on in your real clock. As I only came across AV from you I think I need to read more about sources of noise. Whilst you are at it you should make caps for the rest of us, me at least.
                This is certainly an exciting ride, much better than moaning about the state of the world.

                regards Martin

                #634242
                SillyOldDuffer
                Moderator
                  @sillyoldduffer
                  Posted by Martin Kyte on 19/02/2023 18:55:10:

                  My post not intended in any way to cast aspersions on anyone, particularly you Dave. I think you have just answered the question of ‘what am I missing’ which would be how do you interpret the graph to make meaningful sense of what’s going on in your real clock. As I only came across AV from you I think I need to read more about sources of noise. Whilst you are at it you should make caps for the rest of us, me at least.
                  This is certainly an exciting ride, much better than moaning about the state of the world.

                  regards Martin

                  Oh dear, sorry if my reply came over tetchy. No offence taken and my tongue was firmly in my cheek – should have used an emoji. I don't mind aspersions either, they're good for the soul.

                  Here's one for a Shortt-Synchronome:

                  Be grateful If anyone can explain to this poor student how to read Allan variance.

                  embarrassed

                  Dave

                  #634243
                  John Haine
                  Participant
                    @johnhaine32865

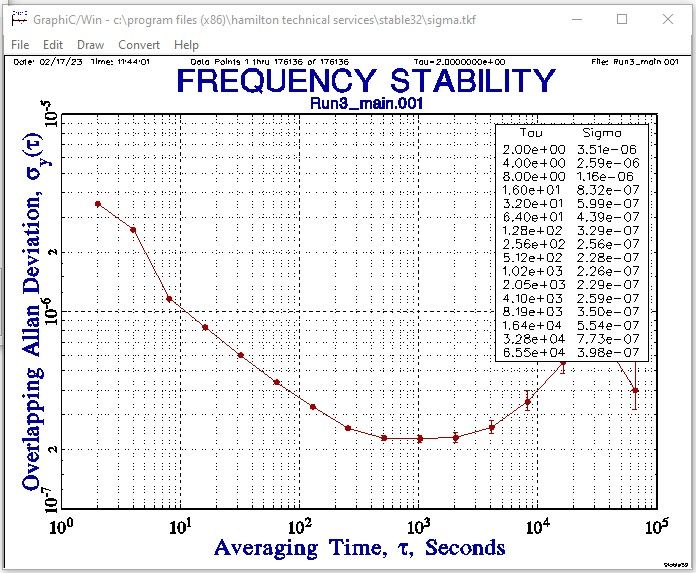
                    How did you compute the AV Dave? I'm just getting to grips with it myself using Stable32 and TimeLab to analyse and plot. But your curve looks upside down compared to most I have seen.

                    jh6_ava.jpg

                    This was the first respectable-looking plot I got from my clock, from about 3 days of data.

                    #634245
                    SillyOldDuffer
                    Moderator
                      @sillyoldduffer
                      Posted by John Haine on 19/02/2023 19:27:29:

                      How did you compute the AV Dave? I'm just getting to grips with it myself using Stable32 and TimeLab to analyse and plot. But your curve looks upside down compared to most I have seen.

                      jh6_ava.jpg

                      This was the first respectable-looking plot I got from my clock, from about 3 days of data.

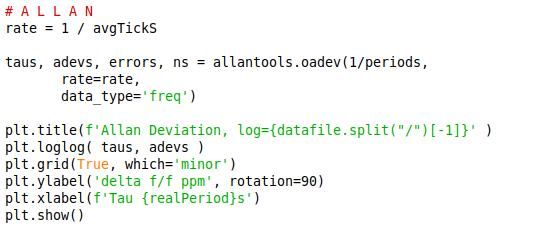
                      I'm using the Python 'allantools' module, described here:

                      The code, most of which is to draw the graph, is:

                      allancode.jpg

                      Could be calling the wrong function with the wrong data.

                      Dave

                      #634261
                      Martin Kyte
                      Participant
                        @martinkyte99762

                        If you Google Measuring Time and Comparing Clocks by J Levine that may provide some useful pointers. The paper is available as a PDF

                        regards Martin

                        #634267
                        Martin Kyte
                        Participant
                          @martinkyte99762
                          Posted by SillyOldDuffer on 19/02/2023 19:27:22:

                          Posted by Martin Kyte on 19/02/2023 18:55:10:

                          My post not intended in any way to cast aspersions on anyone, particularly you Dave. I think you have just answered the question of ‘what am I missing’ which would be how do you interpret the graph to make meaningful sense of what’s going on in your real clock. As I only came across AV from you I think I need to read more about sources of noise. Whilst you are at it you should make caps for the rest of us, me at least.
                          This is certainly an exciting ride, much better than moaning about the state of the world.

                          regards Martin

                          Oh dear, sorry if my reply came over tetchy. No offence taken and my tongue was firmly in my cheek – should have used an emoji. I don't mind aspersions either, they're good for the soul.

                          Here's one for a Shortt-Synchronome:

                          Be grateful If anyone can explain to this poor student how to read Allan variance.

                          embarrassed

                          Dave

                          So I’ll have a stab at it from this evening’s reading. Be warned I may be very wide of the mark but I guess you have to start somewhere. The minimum is 10e-8 at one day so that would be average error of 0.8mS per day. There is a flat portion that shows averaging does not reduce the noise so those frequencies exhibit 1/f or flicker noise which I’m told shows there is some memory of error or persistence when small frequency variations occur. The 4 month variation is around 0.9s but this would indicate drift so maybe was corrected for.
                          Shortt Synchronomes claim 1 sec per year or better than 10e-7 days/day so the numbers are in the right ball park. I imagine though that the plots are intended as noise analysis and don’t really tell you how accurate the clock is because not all the noise is random.
                          As I say that maybe completely wrong so I’m very happy to be corrected if someone else wants a go.

                          Returning to Dave’s clock I would have thought that the best use of these plots would be to compare the clock modification by modification to track improvements.

                          regards Martin

                          #634277
                          Michael Gilligan
                          Participant
                            @michaelgilligan61133

                            Here’s an interesting historical benchmark [published September 1989]

                            One of the authors being D.W. Allan

                            **LINK**

                            https://nvlpubs.nist.gov/nistpubs/jres/094/jresv94n5p311_A1b.pdf

                            Some very practical discussion within its 11 pages

                            MichaelG.

                            #634278
                            Michael Gilligan
                            Participant
                              @michaelgilligan61133

                              Posted by SillyOldDuffer on 19/02/2023 18:26:28:

                              […]

                              My questions are:

                              • Is my clock good or bad, and why
                              • Why is the Y scale in the 10⁻¹² region, and what does it mean

                              .

                              Glib answers at about 05:30 [not asleep but not really awake]

                              1. see [2]
                              2. either because your clock is much better than the Shortt, or because there is something ‘unusual’ about your data-set

                              MichaelG.

                              #634279
                              Michael Gilligan
                              Participant
                                @michaelgilligan61133

                                [ double posted ] … but now using it to add a PostScript

                                _____
                                 

                                At the risk of unintentionally duplicating a previous reference … I’ve just found this:

                                https://home.engineering.iastate.edu/~shermanp/AERE432/lectures/Rate%20Gyros/Allan%20variance.pdf

                                https://home.engineering.iastate.edu/~shermanp/AERE432/lectures/Rate%20Gyros/Allan%20variance.pdf

                                … which is both reasonably concise, and full of hard sums blush

                                MichaelG.

                                Edited By Michael Gilligan on 20/02/2023 06:13:06

                                #634281
                                Joseph Noci 1
                                Participant
                                  @josephnoci1
                                  Posted by duncan webster on 19/02/2023 18:43:36:


                                  It might need to be fast, but it doesn't need to be super stable. If it zeros a count before you start the pendulum, it can detect centre of swing (when the count changes sign) and output a pulse, this is nominally at 1 second intervals, but I've used my super stable accurate picPet type device to calibrate it. the output pulses do not rely on the processor's clock

                                  What is the Super accurate picPet source of reference clock? I have not used picPet, but I assume it compare two signals for delta in edge time? And is a 'nominal 1 sec interval' a stable measure of time?…

                                  Edited By Joseph Noci 1 on 20/02/2023 06:07:10

                                  #634282
                                  Joseph Noci 1
                                  Participant
                                    @josephnoci1
                                    Posted by Martin Kyte on 19/02/2023 23:35:11:

                                    ………. I imagine though that the plots are intended as noise analysis and don’t really tell you how accurate the clock is because not all the noise is random.
                                    As I say that maybe completely wrong so I’m very happy to be corrected if someone else wants a go.

                                    Returning to Dave’s clock I would have thought that the best use of these plots would be to compare the clock modification by modification to track improvements.

                                    regards Martin

                                    Not really noise analysis, although you can derive noise performance, phase performance, and other factors from the graphs.

                                    Allan Variance is however a prime measure of stability, NOT accuracy. The frequency being 'measured' can be inaccurate, but if it is STABLE, the graph will show it – A good double oven OCXO – 10 minus 12, Maser, 10 minus 16 @ tau 10 days… or better..

                                    Sheesh – I need to get a life..

                                    #634283
                                    Joseph Noci 1
                                    Participant
                                      @josephnoci1
                                      Posted by SillyOldDuffer on 19/02/2023 18:26:28:

                                      This is the Allan Deviation for my clock, taken just now. It covers 460999 beats, (or 4 days, 10hours, 38minutes in real money.)

                                      1902allan.jpg

                                      My questions are:

                                      • Is my clock good or bad, and why NO IDEA! the data is incorrect – the graph is mirrored to start, cannot start with good AV and become poorer. Assuming the data set is reverse order, it is still meaningless – A mechanical pendulum with near 10 minus 13 AV would make you a miracle of the next coming…

                                      Please be gentle with me( NO CHANCE – you wanted to join Time Nuts..), my next project is a Dunce Cap.

                                      blush

                                      Dave

                                      #634287
                                      Michael Gilligan
                                      Participant
                                        @michaelgilligan61133

                                        Still paddling-about in the shallow water … I’ve just downloaded this, which is recent and looks very promising:

                                        **LINK**

                                        https://www.mdpi.com/2079-9292/10/6/716

                                        [quote] a design for a GPS-disciplined oscillator is presented that achieves an accuracy of 5 μs rms in its operational environment, while consuming only 45 mW of average power. The circuit is implemented in a system called geoPebble, which uses a large grid of wireless sensors to perform glacial reflectometry. [/quote]

                                        MichaelG.

                                        #634299
                                        SillyOldDuffer
                                        Moderator
                                          @sillyoldduffer
                                          Posted by Joseph Noci 1 on 20/02/2023 06:23:52:

                                          Posted by SillyOldDuffer on 19/02/2023 18:26:28:

                                          This is the Allan Deviation for my clock, taken just now. It covers 460999 beats, (or 4 days, 10hours, 38minutes in real money.)

                                          1902allan.jpg

                                          My questions are:

                                          • Is my clock good or bad, and why NO IDEA! the data is incorrect – the graph is mirrored to start, cannot start with good AV and become poorer. Assuming the data set is reverse order, it is still meaningless – A mechanical pendulum with near 10 minus 13 AV would make you a miracle of the next coming…

                                          Please be gentle with me( NO CHANCE – you wanted to join Time Nuts..), my next project is a Dunce Cap.

                                          blush

                                          Dave

                                          That's very helpful Joe! It means the problem is due to me not understanding how to use the software, and I can tackle that given time. The Python Allantools module provides several options, each of which has to be fed appropriate data, and I'm guessing.

                                          Garbage In, Garbage Out…

                                          I've probably got the same problem with FFT

                                          Dave

                                          #634301
                                          John Haine
                                          Participant
                                            @johnhaine32865

                                            Dave, I got a quick intro to using ADEV from Tom VB. What I do is this (basically what I am told).

                                            • I measured the periods of the pendulum to get a long time series
                                            • Then subtracted from these a mean period computed from (another, previous) long time series (but could be the same one)
                                            • This gives an equally long series of period differences
                                            • Then do a running sum of these to get the phase (i.e. time) deviation from a uniform tick
                                            • Run the ADEV tool on these as phase data – I think this is the same as the "minimal demo" mentioned

                                            You could try Stabe32 and/or TimeLab as well – both are free and widely used by time nuts I think.

                                            I may have made a fundamental mistake with the GPS device – do you have an active antenna, and did you have to enable the power supply to it through CFG?  

                                            Edited By John Haine on 20/02/2023 10:28:28

                                            #634310
                                            SillyOldDuffer
                                            Moderator
                                              @sillyoldduffer
                                              Posted by John Haine on 20/02/2023 10:17:26:

                                              Dave, I got a quick intro to using ADEV from Tom VB. What I do is this (basically what I am told).

                                              • I measured the periods of the pendulum to get a long time series
                                              • Then subtracted from these a mean period computed from (another, previous) long time series (but could be the same one)
                                              • This gives an equally long series of period differences
                                              • Then do a running sum of these to get the phase (i.e. time) deviation from a uniform tick
                                              • Run the ADEV tool on these as phase data – I think this is the same as the "minimal demo" mentioned

                                              You could try Stabe32 and/or TimeLab as well – both are free and widely used by time nuts I think.

                                              I may have made a fundamental mistake with the GPS device – do you have an active antenna, and did you have to enable the power supply to it through CFG?

                                              Thanks for the Allan hints, not what I've been doing! I'll give them a try. Tom knows his stuff!

                                              Yes, both my GPS modules need an active antenna unless operated outside in the clear. The M8Q works reasonably with a passive antenna in my dining room window, but results vary depend on which satellites are in view as the earth rotates. The Adafruit needs an active antenna in the same position.

                                              u-centre has a panel showing what's in view and which satellites are being used and how strong they are. They wax and wane, usually new ones arrive overhead to replace the disappearances, but not always. Occasionally the number of usable signals can fall enough to drop PPS out until new ones appear over the horizon. It's because my house shadows out a swathe of sky. At the moment about half the satellites are in the shadow.

                                              Another factor is how long the GPS has been running. Out of the box they don't know the right time and have no memory of which satellites are in view and when. Left running they build an ephemeris, and then knowing when and for how long they will be visible allows the receiver to switch between satellites before the signal gets too weak. The receiver works much better once it has an ephemeris, making drop-outs less likely and recovery faster. Try leaving the unit running all day to see if it improves.

                                              I didn't have to change anything in CFG to activate the antenna: u-center reports my antenna default is set to enable the supply and do a short circuit shutdown if necessary. I don't understand GPS antennas well enough to recommend changing anything, but a passive antenna might work better with UBX-CFG-ANT "Enable supply voltage control signal" unticked.

                                              Dave

                                              #634314
                                              SillyOldDuffer
                                              Moderator
                                                @sillyoldduffer

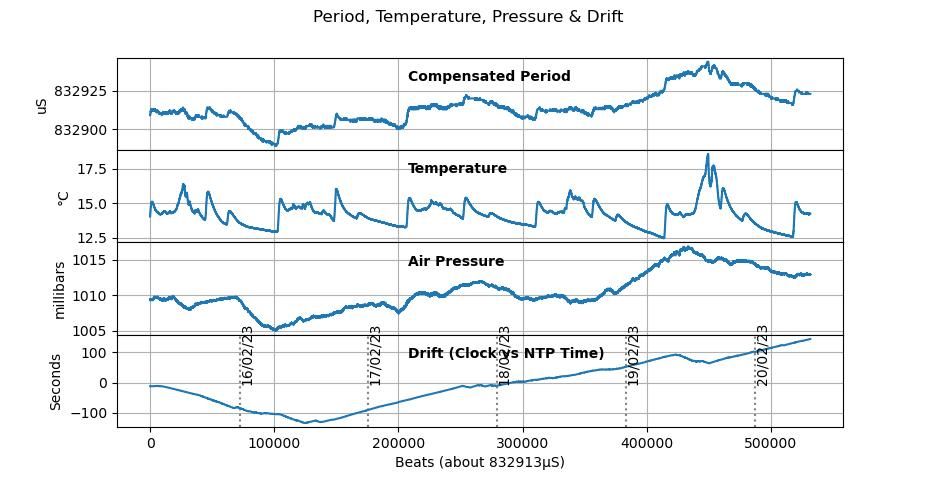
                                                This mornings graphs continue to support an earlier observation, which is that my temperature and pressure compensation values aren't correct:

                                                2002drift.jpg

                                                Drift appears to be following air-pressure, with a hint that temperature excursions have a smaller effect. Now the physical effect on pendulum period due to air density changing the bob's buoyancy must be small. Therefore, the drift is probably caused by my clock over compensating for air pressure. There's something wrong with my code, or my maths, or the multi-variable regression. Possibly all three! Regression is chief suspect because the code and maths are simple, and I don't understand regression properly.

                                                Dave

                                                #634315
                                                John Haine
                                                Participant
                                                  @johnhaine32865

                                                  Thanks for the hints on the antenna. Actually it's running much better this morning but I think I'll still change the antenna – I've asked a friend who is an antenna guru for a recommendation. I've even now got a fix with EGNOS differential correction!

                                                  Thanks for that link Michael, looks interesting.

                                                  #634360
                                                  SillyOldDuffer
                                                  Moderator
                                                    @sillyoldduffer
                                                    Posted by SillyOldDuffer on 20/02/2023 11:24:42:

                                                    Posted by John Haine on 20/02/2023 10:17:26:

                                                    Dave, I got a quick intro to using ADEV from Tom VB. What I do is this (basically what I am told).

                                                    • I measured the periods of the pendulum to get a long time series
                                                    • Then subtracted from these a mean period computed from (another, previous) long time series (but could be the same one)
                                                    • This gives an equally long series of period differences
                                                    • Then do a running sum of these to get the phase (i.e. time) deviation from a uniform tick
                                                    • Run the ADEV tool on these as phase data – I think this is the same as the "minimal demo" mentioned

                                                    Thanks for the Allan hints, not what I've been doing! I'll give them a try. …

                                                    I was doing OK until bullet 4: 'Then do a running sum of these to get the phase (i.e. time) deviation from a uniform tick'

                                                    Could you give an example please showing how the operation would effect a vector of period differences?

                                                    What I have so far is an array (vector) of period values called 'ticks':

                                                    [13302951. 13296366. 13300221. … 13295832. 13303944. 13284340.] Each number is a period measured in units of 62.5nS

                                                    ( Only the first and last 3 elements of the vector are printed. The vector contains 531679 elements.)

                                                    np.mean(ticks) gives the average which is 13320548.098758837

                                                    ticks – np.mean(ticks) subtracts the mean from every element in the vector. Doing so gives:

                                                    array([-17597.09875884, -24182.09875884, -20327.09875884, …,
                                                    -24716.09875884, -16604.09875884, -36208.09875884])

                                                    I think of this operation as normalising the data, that is making each value relative to zero. Is that right?

                                                    By a running sum do you mean subtract each element in turn from the one in front, thus:

                                                    -17597.09875884 – -24182.09875884 = 6585,
                                                    -24182.09875884 – -20327.09875884 = -3855
                                                    -20327.09875884 – … =

                                                    which is, in python numpy:

                                                    normals = ticks – np.mean(ticks)
                                                    diffs = normals[0:-2] – normals[1:-1] # subtract each element from the one before
                                                    print(diffs)
                                                    [6585., -3855., -92042., …, 2044., -7831., -8112.]

                                                    Hope I'm on the right track, ta,

                                                    Dave

                                                    #634367
                                                    John Haine
                                                    Participant
                                                      @johnhaine32865

                                                      When you subtract the mean you get the period error. If you add those up as a running sum you get the phase error from a perfect clock with the average period. So you are integrating the error. Start with zero, add the first difference to get the first error, then add each successive difference to the sum.

                                                    Viewing 25 posts - 526 through 550 (of 562 total)
                                                    • Please log in to reply to this topic. Registering is free and easy using the links on the menu at the top of this page.

                                                    Advert

                                                    Latest Replies

                                                    Viewing 25 topics - 1 through 25 (of 25 total)
                                                    Viewing 25 topics - 1 through 25 (of 25 total)

                                                    View full reply list.

                                                    Advert

                                                    Newsletter Sign-up