I thought that worth investigating and set up a server program on a raspberryPi3B that responds to network requests by returning the Pi's NTP time.
The Pi is connected by Wifi to my router.
I wrote a client for my workstation that asks the Pi for NTP time every second, and timestamps the reply. The workstation is directly connected to the router with a cable, so is one layer closer to atomic time than the Pi.
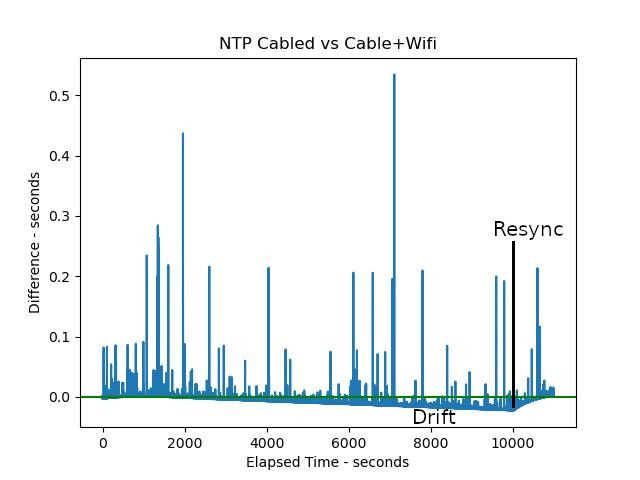
In the example, the two NTP times differ by about 3 milliseconds, but the graph shows wilder excursions and that the Pi and Workstation clocks drift apart, until a correction occurs (marked Resync):
Mean difference between the two NTP sources is -4.15mS, including network delay of about +5mS. But the clocks are quite noisy, at one point over half a second apart, and they drift slowly apart until one or both resynchronises with an NTP server on the internet. So NTP is good, mostly almost always considerably better than 100mS, but far from perfect. A good chunk of the errors are likely due to both computers multi-processing, causing delays if either happens to be busy doing something else.
Anyway, it appears John is right. Very likely some of my troubles may are caused by NTP and the Linux computers I'm using – neither is real-time. I did say at the outset that NTP was good on average, but not sub-second reliable.
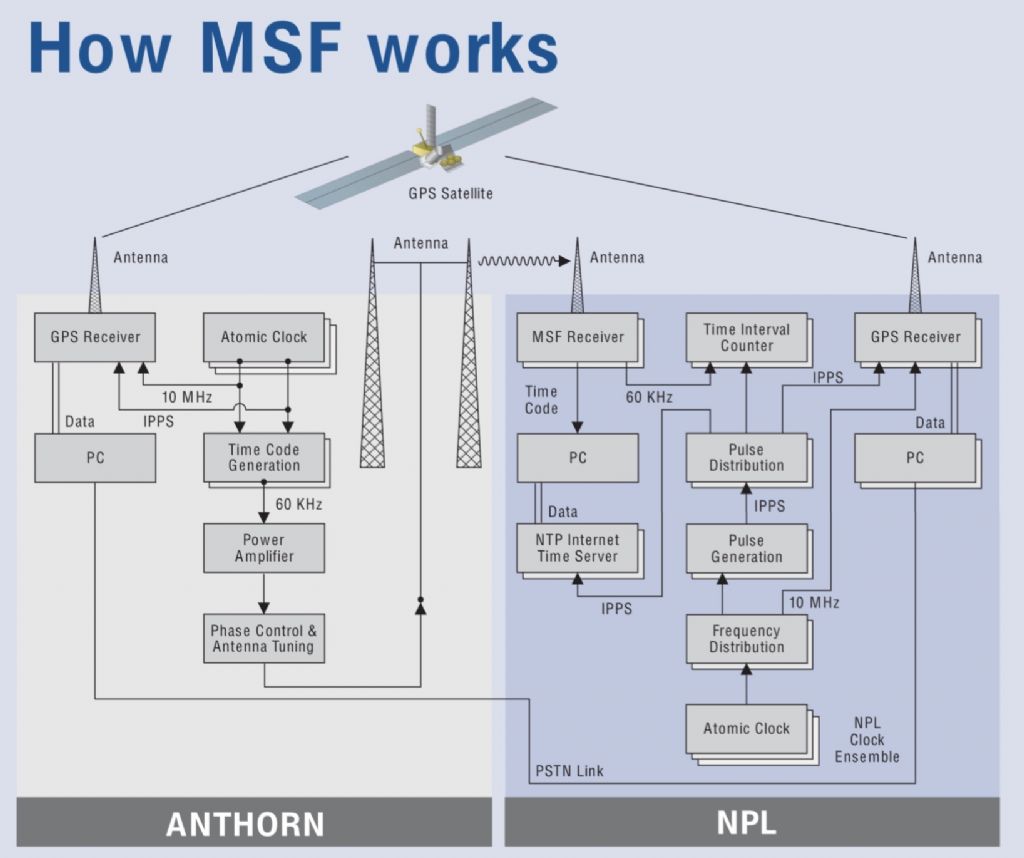
I think that MSF and its cousins dcf etc intend you to use the carrier envelope for continuous 1 pps edges, the start of each break in the carrier.
.
Quite possibly, John … but that doesn’t stop me being interested in the spin-off possibilities, and they do state quite clearly how accurate/stable the frequency of the the carrier is. … I see it as being only “one layer” detached from the “UK primary frequency standards” that define everything.
MichaelG.
.
Incidentally: I found an interesting paper from NIST, about the history of WWVB
I guess that by the time we needed to subdivide the second the use of decimal notation was common and it would have been natural to use it rather than continue on the sexagesimal route.
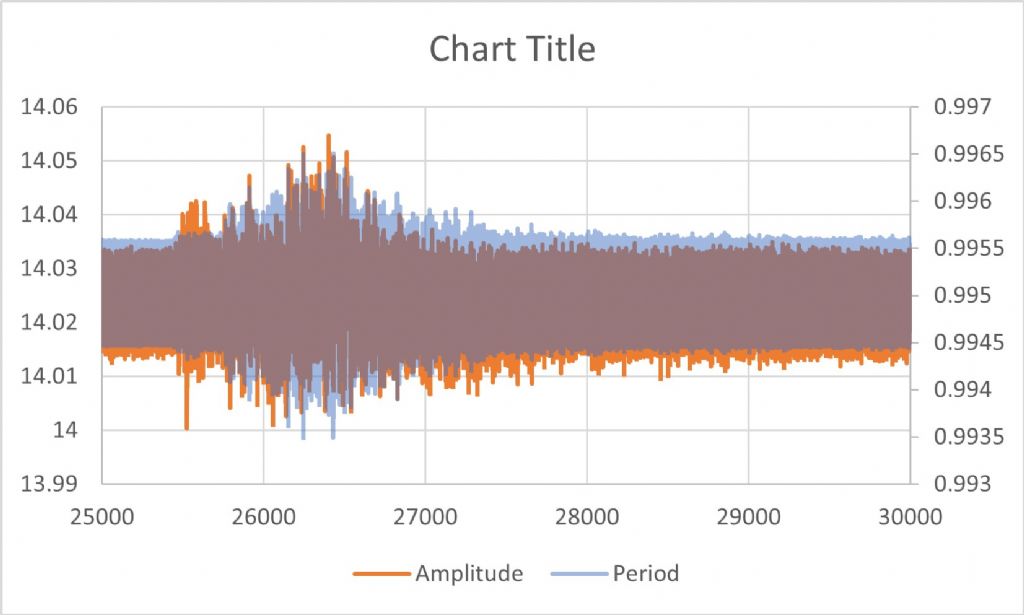
Dave, were you logging from your clock overnight? Fortuitously I completed my logging setup yesterday and set it off about 18.20 last night, stopping it about 10.30 this morning as there were some changes I knew were needed. I got a couple of emails today from Tom in the US asking if I'd detected the Turkey earthquake so I had a quick look at the data and saw this:
Left axis is amplitude (mm), righthand axis period (s). At the moment the main sensor isn't quite centred so alternate periods are slightly different, and this affects the amplitude measurement as well. That's why there's all the "fuzz" on both plots. You can see the big burst of transients at a time which corresponds to the quake (which was at 01.17 UTC I believe). My clock is a seismometer as well! Would be interesting to see if you detected this too?
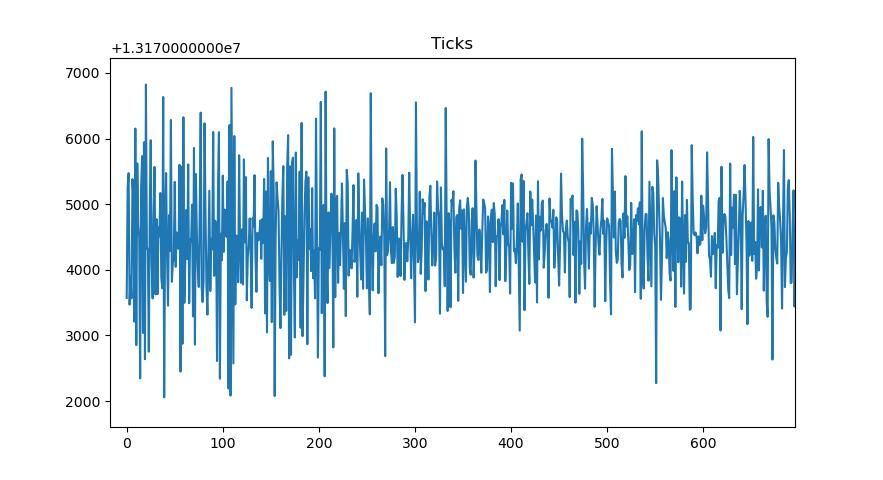
Yes it was running, but I see nothing like your result in my log, maybe just a hint:
X=0 on the graph is 2023-02-06 01:16:49 and 200 is 2023-02-06 01:19:34
My pendulum is vibration sensitive, but I've not seen much sign of it since moving the clock to a solid window sill.
I wonder if the direction of swing makes a difference? Mine is aligned about 100° off true North.
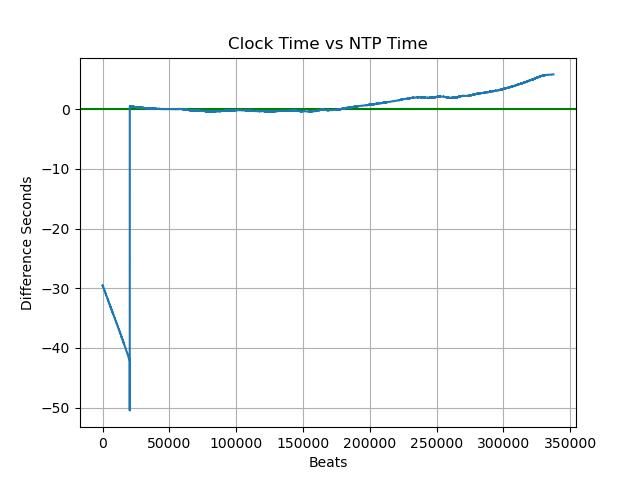
After keeping step for 36 hours my clock started gaining over NTP at beat=180000 and is now nearly 6 seconds fast (mostly over the last 17 hours):
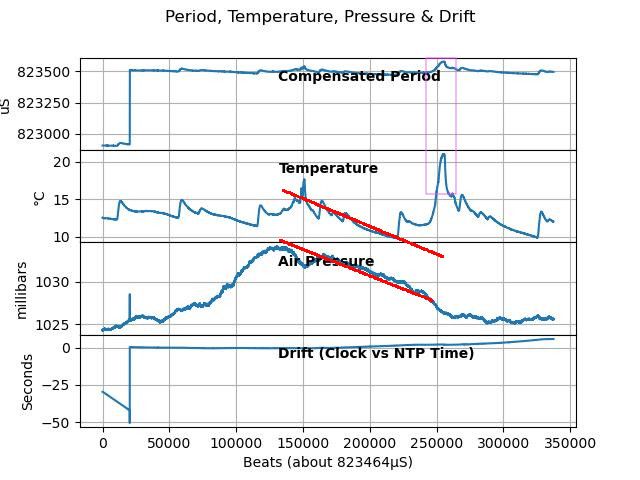
Not obvious that the cause is environmental, but it may have been triggered by air pressure and temperature falling together – red lines below:
Possibly due to fault compensation. I already know it's imperfect, a hint being in the purple box above, where a temperature spike causes a bump in compensated period. More sinister there's a statistical correlation between drift and both pressure and temperature. (Pearson)
Drift & Pressure -0.62
Drift & Temperature -0.26
I've decided to let the clock run to see what it does next.
In the meantime, get the OCXO running – it's nearly finished. Then see if I can get the graph X axis to show real hours and minutes rather than beats. At the moment my graphs don't show what's the clock is doing relative to night and day, and beat scales make it hard to look for earthquakes at 01.17 UTC! Also follow up SKs suggestion about the strange Amplitude vs temperature graph.
A more detailed response to S K's question about measuring amplitude. Basically I assume that the velocity of the vane (or pin) interrupting the beam is constant near the centre of swing, which it must be nearly since it's a maximum. Then knowing the slot width W and interruption duration T you can calculate the velocity, and if you know the period the amplitude follows from:
Ampl. = W x P/(2*pi*T)
As my sensor is not perfectly centred (only microns off but the beats are very slightly different) I calculate 2 values on opposite directions and average. (The faintest turn of the adjusting micrometer makes a measurable difference at the time resolution that the picPET gives.)
This works well with fast opto sensors, probably not so well with Hall effect which have significant hysteresis.
One might ask, given you want to know amplitude, is it sufficient to actually infer it from a time measurement? Well it's much easier to get a real time amplitude by in effect measuring velocity, very hard to get a reading of the actual amplitude. At the end of the day it is timekeeping that's the important thing.
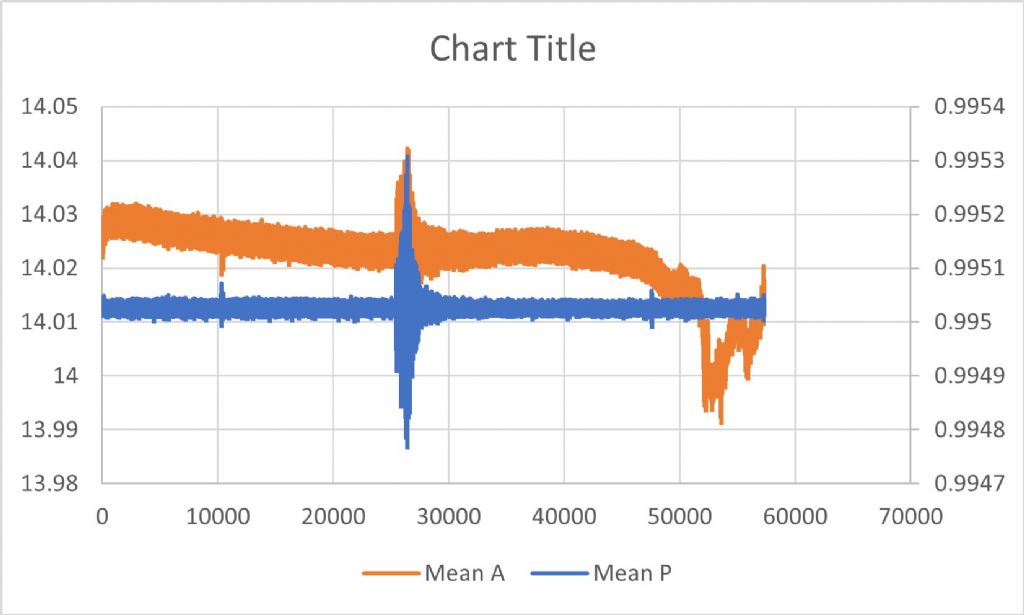
A couple more quake plots, having done some crude averaging on the data.
This is a better version of the previous one with much of the "fuzz" removed.
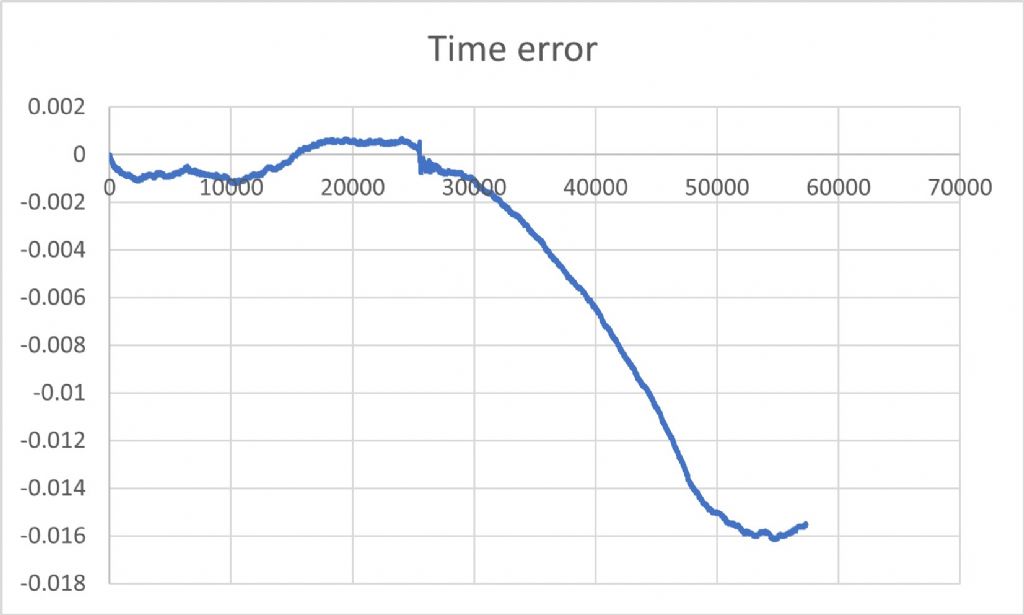
This is the actual timekeeping. Hmmm. Not sure what's happening after the quake or whether it's related, or just because the room was cold. Clearly the amplitude dropped, though by only 0.04mm or so. But one can see the time transient caused by the quake, a fraction of a millisecond.
After keeping step for 36 hours my clock started gaining over NTP at beat=180000 and is now nearly 6 seconds fast (mostly over the last 17 hours):
Not obvious that the cause is environmental, but it may have been triggered by air pressure and temperature falling together – red lines below:
Possibly due to fault compensation. I already know it's imperfect, a hint being in the purple box above, where a temperature spike causes a bump in compensated period. More sinister there's a statistical correlation between drift and both pressure and temperature. (Pearson)
Drift & Pressure -0.62
Drift & Temperature -0.26
I've decided to let the clock run to see what it does next.
In the meantime, get the OCXO running – it's nearly finished. Then see if I can get the graph X axis to show real hours and minutes rather than beats. At the moment my graphs don't show what's the clock is doing relative to night and day, and beat scales make it hard to look for earthquakes at 01.17 UTC! Also follow up SKs suggestion about the strange Amplitude vs temperature graph.
Dave
Falling temperature should increase air density, and falling pressure should reduce it, so if you get a fall in both they should offset each other to some extent. Are you measuring humidity? That changes density as well.
It would make life a lot easier if you could temporarily control the environment so that you could change one thing at a time, but that in itself isn't easy.
One might ask, given you want to know amplitude, is it sufficient to actually infer it from a time measurement? Well it's much easier to get a real time amplitude by in effect measuring velocity, very hard to get a reading of the actual amplitude.
Thanks. Yes, it's difficult to imagine how to "actually" measure it in a practical and accurate way. Video of the swing against a scale? Digitizing a Hall effect sensor mounted near the apex of the swing? A capacitive sensor, similarly? Laser interferometry?
I've also thought about mounting a sensor a degree (or a few) off BDC, and tuning the impulse scheme in a tight hit-and-miss fashion (ideally: one hit, one miss, …), to maintain the swing right at the hit/miss cutoff. That way, a measurement could potentially be made while not swinging at all, though at that point there might be less use for such a measurement.
[…] very hard to get a reading of the actual amplitude.
Thanks. Yes, it's difficult to imagine how to "actually" measure it in a practical and accurate way. […]
.
Always provided that we only need to accurately measure small distances [i.e. the tiny discrepancies in a notionally constant swing] it shouldn’t present any great problem … a camera sensor can provide pixel resolution and microscope optics the appropriate magnification.
Even a very basic webcam will have a native resolution of 640×480 pixels … Scale it such that 1/4” covers 635 pixels and you can detect position to ten microns.
Actually it's only convention to think in terms of amplitude. We could just as well write all the equations in terms of velocity, then measuring the velocity is quite natural.
There's an "offset sensor method" for measuring amplitude with a timing system such as the Microset which sounds a bit like your proposal. The hit and miss scheme is more or less what I use, as does Doug Bateman in his clock.
Actually it's only convention to think in terms of amplitude. We could just as well write all the equations in terms of velocity, then measuring the velocity is quite natural.
Interesting point – I can see that, thanks.
For my project, I'm mainly interested in the period. It can be of arbitrary duration in that it doesn't have to count time in seconds, but I want to know it as precisely as possible. This likely means measuring it with as small an amplitude as possible.
One idea I have is to measure the period with greater accuracy than a typical opto-interrupter, even at very small amplitudes, e.g. as small or smaller than the aperture of the Sharp photointerrupter. Imagine a bright polished pin extending below the pendulum. Aim a laser at this, and mount a photodetector some way's off and at an angle to the axis of the laser. The beam should then sweep across the photodetector quite quickly as the laser crosses the curved pin, presumably with improved timing accuracy. This should work even at extremely small amplitudes as long as the photodetector is mounted in an appropriate angle and distance from the pin.
Actually it's only convention to think in terms of amplitude. We could just as well write all the equations in terms of velocity, then measuring the velocity is quite natural.
Interesting point – I can see that, thanks.
[…]
.
I confess to being particularly thick-headed at this ungodly hour, but I’m afraid the point is lost upon me:
If the equations are written in terms of velocity, then the peak of the swing is at velocity=Zero
So far, so good … but, if we are all agreed that a real pendulum is not isochronous, surely we need to know at what point in space that occurs
I must be missing something … What mathematical conjuring makes it possible to ‘tune’ the pendulum without controlling its arc ?