Experimental Pendulum Clock
Experimental Pendulum Clock
Home › Forums › Clocks and Scientific Instruments › Experimental Pendulum Clock
- This topic has 561 replies, 22 voices, and was last updated 27 February 2023 at 22:17 by
duncan webster 1.
-
AuthorPosts
-
8 January 2023 at 13:20 #628168
SillyOldDuffer
Moderator@sillyolddufferPosted by Michael Gilligan on 07/01/2023 17:17:30:Posted by SillyOldDuffer on 07/01/2023 11:47:28:[…]
Another problem is that barometric compensation isn't working properly, period rising as pressure falls:
.
I hope you don’t mind me mentioning this, Dave … I think that statement is more exactly true than you might have thought when you wrote it. [at least in terms of your plots, if not in reality]
I have just copied your picture and flipped it: and so far as I can tell visually, they match precisely.
Unless I am stating the obvious [in which case, shut me up], I would suggest you check what data you are actually plotting.
MichaelG.
Not obvious at all, and although I was 99% certain, I double checked! The scale of the graphs are different, so although the shape is identical, the values aren't. The graph drawing software scales period and pressure to fill the space available, so they look identical, but one is much smaller than the other.
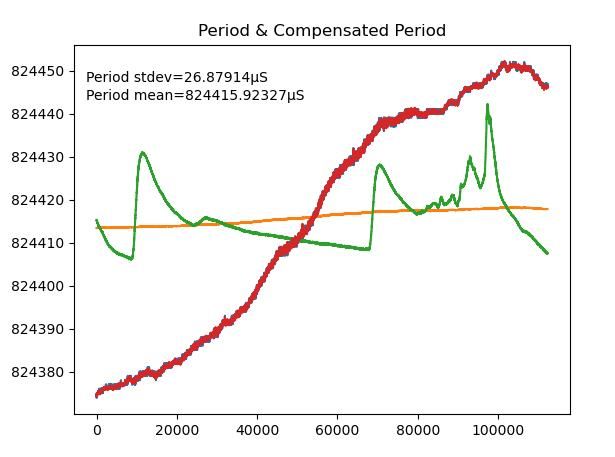
This graph shows raw period and the effect of each compensation individually at the same scale, which creates a different impression:
Uncompensated period is the blue line running diagonally up from bottom left to top right. It's hard to see because it;s mostly overlaid by the red line.
The red-line is period compensated for air pressure. Changing air pressure doesn't effect period by very much, so compensating for it doesn't make much difference.
Temperature change has a much larger effect on period. Compensating for it produces the green line, which, although it zigzags alarmingly across the graph, the line is much more horizontal, and it varies over a much smaller range than uncompensated period.
The zigzags show that simply compensating for temperature isn't enough – something else is at play. Although I've noted Duncan's comment about air density being a combination of pressure, temperature and humidity, this graph shows my earlier idea, which is correcting for temperature highlights the much smaller effect of air pressure, Thus, I simply correct the temperature corrected periods for pressure.
This produces the orange line, almost horizontal, and of tiny range.
The graph simulates corrections applied long after the clock produced the data. It looks good but might not be right due to my faulty logic, a mistake in the programs, or coincidence.
Not all is well. When the same corrective logic was applied by the clock itself, the results show the pendulum is still being influenced by changing air pressure. Although the residual effect is measured in microseconds, it shouldn't be detectable at all. Although what I've done is much better than not bothering, the clock should perform a notch better than it does. Be nice to fix it if I can!
High-end pendulums deal with changing air pressure by running in a vacuum. May be easier to do that than compensate for it with a computer, but it's interesting to see how good a result I can get. The theoretical limit is the resolution of the pressure sensor, which is a BME280.
Dave
Edited By SillyOldDuffer on 08/01/2023 13:21:08
8 January 2023 at 13:32 #628170David Tocher
Participant@davidtocher94033Your linear model is of the form y_p = a + m-1x_1 + m_2 x_2 + … , where y_p is the predicted pendulum period, a, m_1, m_2 + … are the parameters found by a least squares fit from your data x_1, x_2 x_3 …
You need to present to whatever stats tool you are using a list of observed y (dependant variable) and the associated independant variables x_1, x_2, x_3 etc. Press the 'go' key and somewhere in the output you will find the values for a, m_1, m_2 etc along with data to indicate how good a fit the model is to your data and the covariance matrix which gives a measure of independence of your independent variables.
(Sorry about the crude representation of the maths but I don't have access to an equation editor)
8 January 2023 at 13:43 #628171 Michael GilliganParticipant@michaelgilligan61133
Posted by SillyOldDuffer on 08/01/2023 13:20:17:
[…]
Not obvious at all, and although I was 99% certain, I double checked! The scale of the graphs are different, so although the shape is identical, the values aren't. The graph drawing software scales period and pressure to fill the space available, so they look identical, but one is much smaller than the other.
[…]
The graph simulates corrections applied long after the clock produced the data.
[…]
.
Sorry, Dave … I think that leaves me more confused than before

Given that they are plots of different things, they obviously cannot be scaled identically [which is fine]
BUT … if they are identical shapes; are you saying that the pendulum tracks barometric pressure variations perfectly and instantaneously ?I need to go food-shopping now … will return in due course, to face my ridicule.
MichaelG.
8 January 2023 at 14:46 #628184SillyOldDuffer
Moderator@sillyolddufferPosted by Michael Gilligan on 08/01/2023 13:43:34:Posted by SillyOldDuffer on 08/01/2023 13:20:17:
[…]
Not obvious at all, and although I was 99% certain, I double checked! The scale of the graphs are different, so although the shape is identical, the values aren't. The graph drawing software scales period and pressure to fill the space available, so they look identical, but one is much smaller than the other.
[…]
The graph simulates corrections applied long after the clock produced the data.
[…]
.
Sorry, Dave … I think that leaves me more confused than before

Given that they are plots of different things, they obviously cannot be scaled identically [which is fine]
BUT … if they are identical shapes; are you saying that the pendulum tracks barometric pressure variations perfectly and instantaneously ?I need to go food-shopping now … will return in due course, to face my ridicule.
MichaelG.
I'm confused too, which is why I'm seeking advice!
To reprise what I'm doing:
- In learning mode the clock measures period as accurately as I can manage, and also temperature, air pressure and humidity. The data is reported on every beat, roughly every 840mS, so the log contains a fine-grained record of perfomance and environment over a long time, ideally several days.
- Still in learning mode, the log is analysed statistically. The results suggest a strong relationship between period and temperature and between period and air pressure. The mathematical nature of these relationships is linear and can be extracted as a simple formula. Considering temperature only, measurement of many samples tells me what the pendulum period should be at any temperature, and knowing the temperature when the pendulum ticks allows a "perfect" period to be counted.
- In the clock, on registering a tick, the counter adds the best period for the current temperature. In doing so, it assumes the pendulum is behaving normally, within the limits established by statistical analysis of the learning phase data. This is OK unless something goes wrong mechanically and the pendulum behaves abnormally. In addition to correcting for temperature, the maths also filter out noise – minor variations in period due to flicker etc.
When the clock keeps it's own time, counting corrected periods, another log is captured and the results analysed again. In theory, temperature and pressure should both be factored out, and the clock close to NTP time. In practice, the statistics show a residual error that tracks air pressure exactly. That's a clue!
In 'own time' mode it's not the clock's physical pendulum that tracks air pressure, rather the effect must be due to a software or design error. I'm most doubtful about the way I correct for two independent variables, but it could be rounding error. Although the graphs make the error obvious, and show it tracks air pressure, it's only wrong by a few microseconds.
Hope that makes sense, but I'm fumbling in the dark! Questioning this stuff is very helpful because explaining it forces me to check my own assumptions, not all of which hold water. Breaking wrong assumptions is excellent, because they screw up any chance of me making progress.
Dave
8 January 2023 at 15:43 #628190John Haine
Participant@johnhaine32865Dave, IIRC I previously ran a big set of stats through R for you to get the multivariate coeffs for you – happy to do that again if it helps?
By the way, there are two effects of pressure – one is buoyancy+"accession to inertia", the other is amplitude as the drag changes. That in turn will affect rate through circular deviation – there is though a lag. Might be a good idea to look at amplitude variation as well?
Edited By John Haine on 08/01/2023 15:46:24
8 January 2023 at 16:20 #628196SillyOldDuffer
Moderator@sillyolddufferPosted by John Haine on 08/01/2023 15:43:47:Dave, IIRC I previously ran a big set of stats through R for you to get the multivariate coeffs for you – happy to do that again if it helps?
By the way, there are two effects of pressure – one is buoyancy+"accession to inertia", the other is amplitude as the drag changes. That in turn will affect rate through circular deviation – there is though a lag. Might be a good idea to look at amplitude variation as well?
…
That will be very helpful John if I can't suss out how to do it myself.
Just checked yesterday's run which was meant to fix step jumps, and it hasn't. Alas, the dataset is still faulty. Step jumps didn't occur testing with a signal generator but the pressure/temp/humidity sensors were all turned off. I was able to recreate the problem with a delay() which indicates the steps are time collision related. The slowest measurement is the humidity sensor, and as humidity isn't a factor, I hope, I've turned it off for another try.
The amplitude code isn't working properly at the moment either, so I need to fix that too! I checked for amplitude/period correlation in earlier runs, and found distortion due to excessive impulse power, but having fixed that my code is unlikely to detect a lag of any size. More work, but worth doing thanks!
Not long ago I thought I only had a few software tweaks to do before making a new suspension, . Since then all sorts of new problems and ideas have surfaced. Good job I'm not doing this work on a fixed price contract. My to do list gets bigger every day!
Dave
8 January 2023 at 16:24 #628197John Haine
Participant@johnhaine32865The change in rate will create a phasechange over time, visible as a clock error?
8 January 2023 at 17:20 #628205SillyOldDuffer
Moderator@sillyolddufferPosted by John Haine on 08/01/2023 16:24:17:The change in rate will create a phasechange over time, visible as a clock error?
What would that look like on a graph?
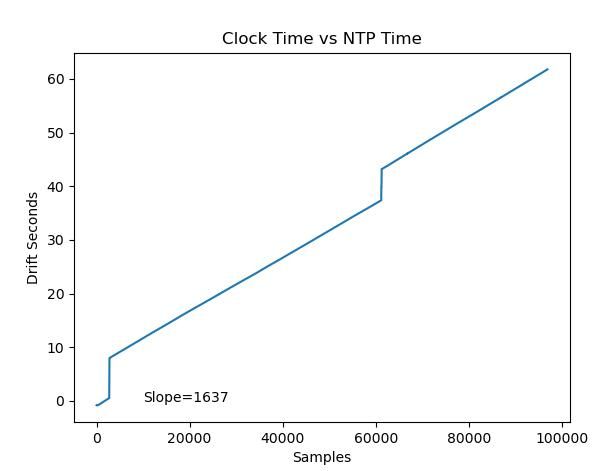
This is yesterday's failed run, with two nasty step jumps:
The graph shows my clock gained 62 seconds over NTP in 22 hours 10 minutes, but the drift rate looks highly predictable. 14 seconds of step error are due to a software bug.
Otherwise, the graph appears to be a dead straight line. Most likely I've set the base period a little fast, and could fix it by subtracting a constant. (Equivalent to taking a penny off Big Ben!)
If the step and drift errors were eliminated, what would the graph look like if phase were changing over time? Maybe the line curves, but is too shallow to see at that scale. Would a different graph show it better?
Dave
9 January 2023 at 11:05 #628297SillyOldDuffer
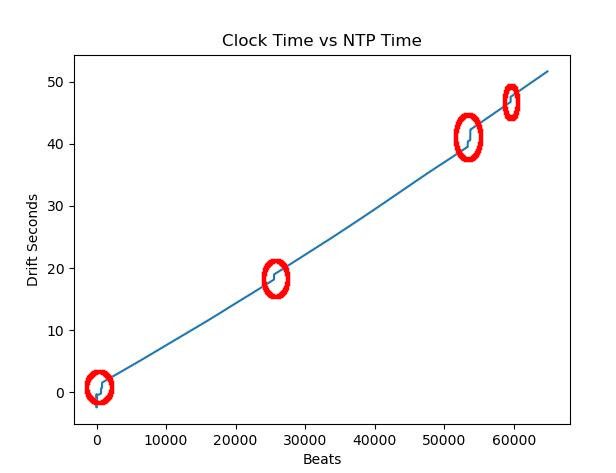
Moderator@sillyolddufferHo hum, this morning's results show I've still got a step jump error, where something corrupts a data value and glitches the serial output, making it look as if the pendulum has dramatically slowed down when it hasn't.
The problem emerged after I added the code needed to calibrate the Arduino's crystal oscillator against GPS seconds. The code is simple but it depends on an interrupt and these are time sensitive.
My code involves 7 time sensitive interrupts:
- The built-in millis() and micros() functions rely on a timer interrupt that fires every 4096uS, and then consumes some tens of CPU micro-seconds incrementing a counter.
- Serial.print(), also a built-in, fires an interrupt to send each character. Not sure how many microseconds are consumed by this, it depends partly on whether or not the USB link and remote receiver are ready to accept data. My log records are about 86 bytes long, taking a little over 15mS to transfer at 57600 baud.
- The pendulum generates a pin interrupt on FALLING. It's used to measure amplitude and occurs once every 834mS or so, consuming a few tens of microseconds.
- The pendulum generates a timer interrupt on RISING. It stops the timer, and calls a software function that calculates the number of ticks since the last RISING event. This consumes a few tens of microseconds.
- The 16 bit pendulum timer runs continuously at 16MHz. At overflow (65535 ticks), it calls a software function that increments an overflow counter. Only a few microseconds are consumed, but it happens every 4mS.
- GPS seconds work in the same way as the pendulum tick counter, using another 16 bit timer. Although GPS RISING events only occur once per second, this timer also overflows every 4mS, also burning a little CPU time.
Interrupts are event driven, that is they respond to the real-world at any time. Normally computers execute instructions in strict sequence, each function consuming however much CPU time it needs. The arrival of an interrupt causes the computer to suspend and save the state of the main program whilst it services the interrupt code. When the interrupt code finishes, the main program is restored and restarted. The cost of suspend and restart in CPU time can be quite high.
Readers will be wondering what happens when two or more interrupts occur in close proximity. The answer depends on how time sensitive the processing triggered by the interrupt is. For example, the interrupt I use to measure amplitude isn't critical and it wouldn't matter if it was delayed for several milliseconds. On the other hand, the CPU being too busy to service serial output due to other interrupts, could cause the serial buffer to overflow.
Interrupt collisions are difficult to predict and have to be managed carefully. The CPU time consumed by interrupts has to be minimised, and the program may have to be written to prioritise them, or protect against collisions. The program might crash, but it's just as likely to recover after a brief spat of weird behaviour.
Tricky stuff. Ordinary applications like Word aren't allowed to use interrupts at all. Instead, interrupts are managed entirely by the operating system, making it difficult to write time critical code on Windows, Linux or Apple. Arduino doesn't have an operating system, so programmers can do whatever they want to the hardware. Timing is much more predictable, hurrah, but the programmer has to be very careful whenever interrupts are used. Looks like I've gone a step too far and created a difficult problem!
Dave
Edited By SillyOldDuffer on 09/01/2023 11:09:06
9 January 2023 at 14:36 #628311duncan webster 1
Participant@duncanwebster1Does the 16 bit timer get disturbed by all this, or does it sail on regardless?
9 January 2023 at 15:41 #628323SillyOldDuffer
Moderator@sillyolddufferPosted by duncan webster on 09/01/2023 14:36:43:Does the 16 bit timer get disturbed by all this, or does it sail on regardless?
Sails on regardless. Timers are hardware peripherals. The CPU can set them up, read results, and be sent interrupts, but otherwise counter timers are independent. They're basically IC shift registers, that the CPU can connect to pins and clocks in various ways. Once set-up, they do their thing continuously.
PWM is a common example. All done by a counter timer configured once by a program. Once the timer is running PWM appears on the output pin without bothering the CPU. Much faster than software PWM, and the CPU is free to do something more useful.
Having a dreadful time today. A short simple program I wrote after breakfast to debug another problem refuses to work properly. Spent all day trying to get it to work, and it's really annoying.
Dave
10 January 2023 at 20:45 #628554SillyOldDuffer
Moderator@sillyolddufferAnother difficult day, but I think I've cracked it. I shall know tomorrow.
Been looking for two software mysterious bugs:
- one of them turned out to be due to the difference between an 8-bit byte and and 8-bit character. In my young day they were both ASCII: not now! A byte can be unicode, and it made a difference. I was bit by a bit, ho ho.
- the second turned out to be a hardware error, so no wonder I couldn't find anything wrong with the program! The issue was noise on the connection between GPS and Arduino, fixed I hope with a 10k resistor that should have been fitted in the first place. Time will tell.
Another cock-up, the USB bulkhead socket needed to box up my OCXO arrived, and I've ordered the wrong thing! Start again.
Also having a torrid time with R, which is a computer language specialising in statistics. Nothing wrong with R except it's new to me, and different from what I'm used to. Made a really good start with it, until I got into details and found I need to read the manuals! Habit is unhelpful: I expect R to be like Python, and it's close enough to build false expectations. Progress slow because too many assumptions are turning out to be ill-founded. Learning is hard!
Dave
12 January 2023 at 15:13 #628861SillyOldDuffer
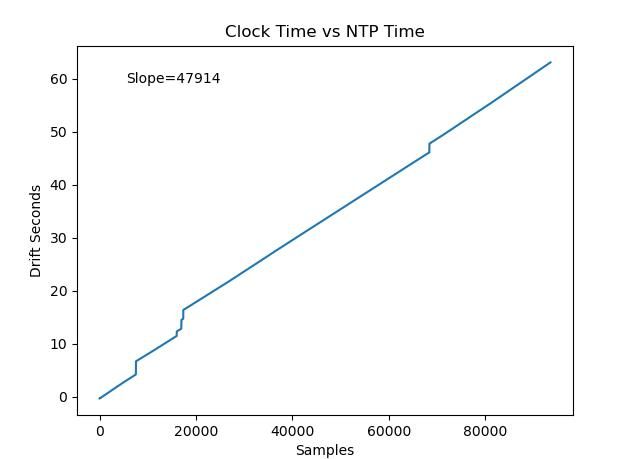
Moderator@sillyolddufferDid I say I thought I'd fixed the electronics? Wrong again – the clock's software is still corrupting the output log, causing time to apparently jump in steps.
I fixed a problem with noise on the GPS input, but not the pendulum input. May be a coincidence, but the stepping problem started after putting the case on. Annoying because the problem is caused by only 17 corrupt records in 93785, Doubly annoying because the fault doesn't occur on my dining table, where an oscilloscope is handy!
More fruitfully, I've followed John's suggestion to use the R statistical package to establish the combined effect of pressure and temperature changes on pendulum period. After half a day flapping about with the wrong end of the stick, R turned out to be simple:
Column numbers: 1 is periods in ticks. 5 is pressures in millibars, and 7 is temperatures
<code>
#!/usr/bin/env Rscript
file <- "clockwork.dta"
data <- read.table(file, sep=' ', header=T)
mlr <- lm(data[c(1,5,7)])
print(mlr)
</code>From my clock log, R suggests this correlation, which looks right:
R Intercept Pressure Temp
14017282.7 -818.8 -2032.5Following clues in the R documentation, I thought I understood how to do the same with Python numpy.
<code>
y = np.column_stack((temps, pressures))
results = np.polynomial.polynomial.polyfit(ticks, y, 1)
</code>The code runs, but the results make no sense to me:
[ 1.38592578e+01 9.95640233e+02]
[-6.42450061e-08 -2.71303053e-07]Two steps forward, three steps back!
Dave
14 January 2023 at 15:26 #629297SillyOldDuffer
Moderator@sillyolddufferNot a happy bunny! No reward after having a determined go at the program yesterday. I changed any and all the code that might cause trouble, no matter how unlikely, and improved the input signal conditioning.
No coconut. Last night's run is still stepping incorrectly due to a software bug, aargh! Has to be fixed before moving on, and I'm running out of ideas.
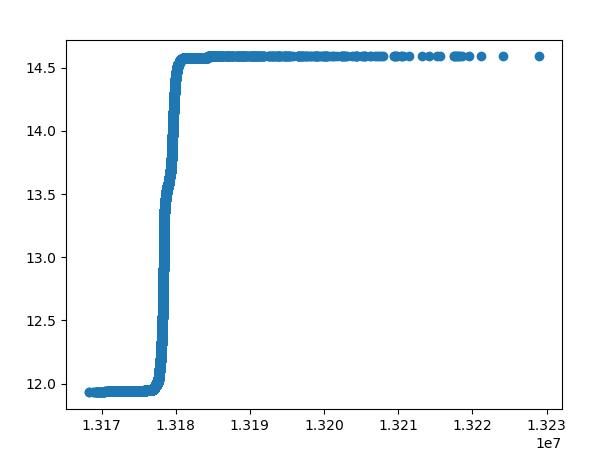
Another confusing graph! Whilst waiting to see if stepping was fixed, I checked my regression assumption. (Regression is a mathematical way of finding how pendulum period varies with temperature and air pressure, but it depends on clean data.) To check the data I graphed the relationship expecting a scatter of results more or less around a straight line. Sort of:
The two flat lines top and bottom of the graph are unexpected. The rising line is consistent with temperature change, but the horizontal top line suggests the bob beats disproportionally fast over a range at the maximum temperature, whilst the lower line suggests it also beats disproportionally slowly at minimum temperature.
Hard to explain. Maybe temperature change causes the suspension spring to move in the clamp, sticking and moving in jerks at maxima and minima?
Whatever the cause, it's unrelated to the stepping issue. Another mystery that has to be solved, because linear regression expects a straight relationship, and corrections derived from a bent _/‾ will be off.

Dave
14 January 2023 at 16:51 #629327David Tocher
Participant@davidtocher94033I'm not sure what the graph shows – there's no labelling of the axes or a title.
Could the amplitude control of the pendulum impulses cause problems?
You could limit the data used for the regression to values within thee linear range.
14 January 2023 at 18:00 #629350SillyOldDuffer
Moderator@sillyolddufferPosted by David Tocher on 14/01/2023 16:51:57:I'm not sure what the graph shows – there's no labelling of the axes or a title.
Could the amplitude control of the pendulum impulses cause problems?
You could limit the data used for the regression to values within thee linear range.
Apologies for the graph, sloppy of me!

The graph is period against temperature.
Y is Temperature from 12 to 14.5C, X is Period in ticks of 62.5nS each. Average period is 13176702 / 16000000s, or 0.823544 seconds in real money.
I'm confident the pendulum isn't being over impulsed because I've reduced to the minimum needed to keep the pendulum swinging reliably and I can't see an obvious relationship between amplitude and period. (May be there though – John Haine suggested the effect may be delayed, and I haven't investigated that yet. If it's there, the effect must be small.)
Limiting the data used to do the regression is naughty if it hides a physical problem. But, many thanks, the suggestion has given me the idea that maybe the graph is misleading. It's a scattergram, and the line may give a false notion of how many data samples are in each segment. Could be the horizontal top and tail aren't representative, perhaps only a few samples compared with a hundred thousand in the vertical section. I can look at that ta,
Dave
16 January 2023 at 02:03 #629582Brian Smith 1
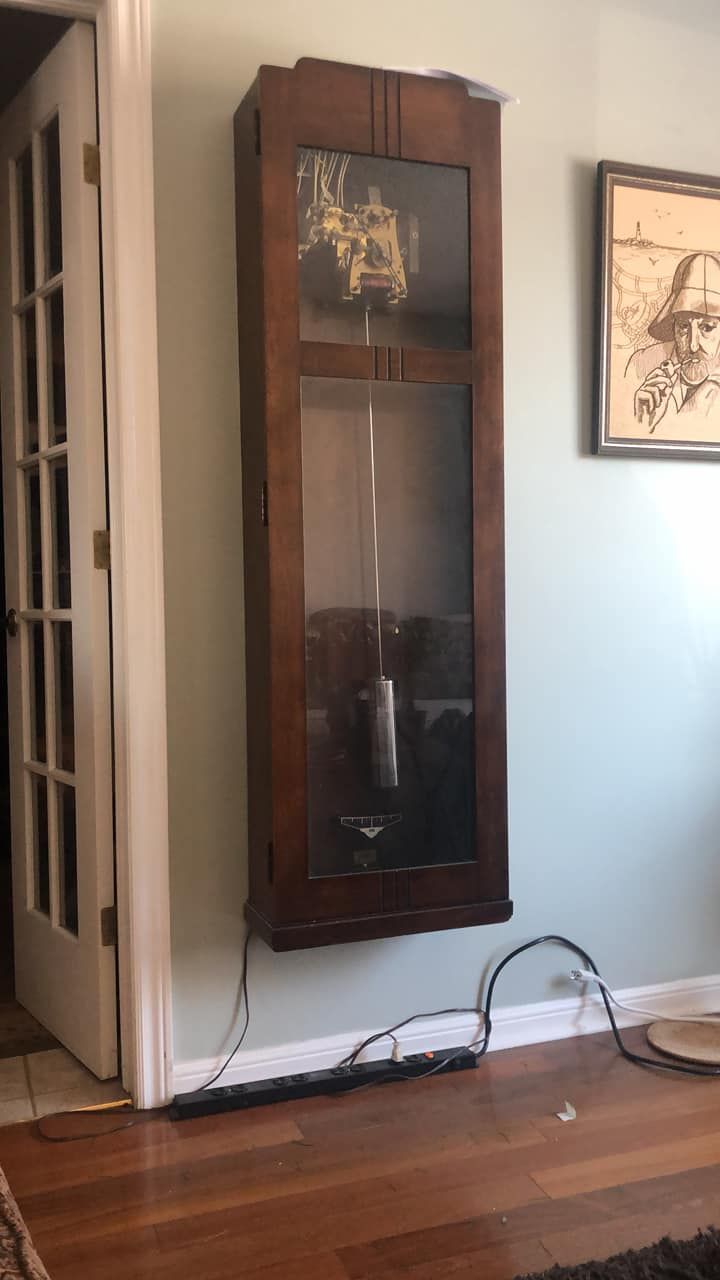
Participant@briansmith1I have read through the posts with some interest, as I have and IBM master clock that I want to kit out with some sensors.
Picture on FB (I cannot see how to post a picture from a macbook, no albums show up in the insert pictures?)
The site below was mentioned once before
precision event timer, I did not see any discussion of it though. Has anyone tried it?
Thanks
Brian
16 January 2023 at 06:53 #629587 Michael GilliganParticipant@michaelgilligan61133
Posted by Brian Smith 1 on 16/01/2023 02:03:34:
.
(I cannot see how to post a picture from a macbook, no albums show up in the insert pictures?)
.
You need to create your Albums first, Brian
I suggest you start here: **LINK**
https://www.model-engineer.co.uk/forums/postings.asp?th=103028&p=1
MichaelG.
16 January 2023 at 07:31 #629589 Michael GilliganParticipant@michaelgilligan61133Posted by Brian Smith 1 on 16/01/2023 02:03:34:
[…]
The site below was mentioned once before
precision event timer, I did not see any discussion of it though. Has anyone tried it?
.
I’ve noticed that page before … but never followed-up

As it’s dated 2009, I don’t even know what [if anything] is available now
Hopefully, John Haine might be able to advise.
MichaelG.
16 January 2023 at 07:47 #629590John Haine
Participant@johnhaine32865I've used PICPETS and I've got one spare waiting for a new clock timer. You'd have to contact Tom to see if he can still supply. They are just PIC micros with specific code and the code is on the website somewhere, I'm awaiting the arrival of some pics and a programmer to try making them.
16 January 2023 at 08:36 #629592 Michael GilliganParticipant@michaelgilligan61133Posted by John Haine on 16/01/2023 07:47:04:
I've used PICPETS and I've got one spare waiting for a new clock timer. You'd have to contact Tom to see if he can still supply. They are just PIC micros with specific code and the code is on the website somewhere, I'm awaiting the arrival of some pics and a programmer to try making them.
.
Grateful if you could elaborate on the programming side, in due course, John

The code is all available on the linked pages:
for example, the Sidereal converter is at the bottom of this page: **LINK**
http://www.leapsecond.com/pic/picdiv.htm
MichaelG.
16 January 2023 at 09:43 #629613Brian Smith 1
Participant@briansmith116 January 2023 at 11:21 #629645SillyOldDuffer
Moderator@sillyolddufferThe PICPET is a delight: it uses the most basic PIC microcontroller in a clever way. Although the chip only has 8 pins, the hardware is particularly suitable for timing pendula! It really is a 'Precision Event Timer'. I give it 5 gold stars!
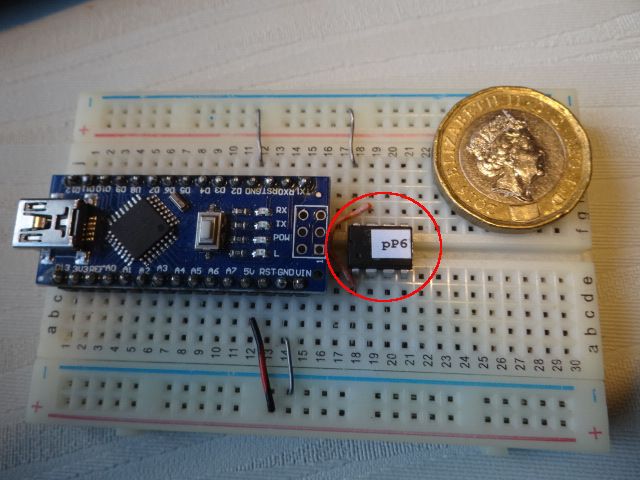
The pP6 is connected to 5V power, Ground, a 10Mhz crystal (or external oscillator), a pendulum sensor (usually a beam breaker) and two pins provide serial output at 9600 baud. The device measures the number of 10MHz ticks between each beam break, and sends the results to an external computer where a serial reading program either displays the results and/or saves the timings to a file for later analysis. The analysis is down to the user: spreadsheet, write your own program, the R statistical package. I prefer Python because I'm familiar with it, and it has lots of advanced built-ins, but not difficult to program averages, standard deviation, etc in other languages including BASIC.
The main problem with Spreadsheets for this application is the sheer volume of data produced by the picOET. At 1 second per pendulum swing, it sends 86,400 samples per day, more than 1 million samples a fortnight. Early versions of Excel could only hold 65,536 rows. The current Excel will stretch to about 1 million rows, but a fast computer with at least 8Gb of memory is needed to do it, and expect sluggish performance.
When the picPET was made available by Tom, most computers came with at least one serial port, and it was easy to wire the picPET up to them. Today most connectivity is done by USB and serial ports have become rare, creating a minor problem. One solution is a USB to serial converter cable, like these examples on Amazon. The breadboard above, a few connections are missing, shows I did it by connecting the pP6 to an Arduino Nano, which was programmed to write whatever it received to USB. (Not difficult to program and many examples on the web.)
Whilst picPET does a brilliant job, I wondered if the same could be done with a more modern microcontroller, to which the answer is yes, no, and maybe! It depends on which one. A typical problem with modern microcontrollers is they get high performance and functionality by adding clever features and a host of go-faster tricks that reduce timing accuracy. They time fast events, but not necessarily with high precision.
Turns out the simpler chips are better for this than the sooper-dooper ones. Some of the Arduinos are suitable, and have advantages compared with the picPET. (disadvantages too!)
Advantages:
- Arduino boards all come with a USB interface – no need to wire up an adaptor. The interface runs much faster than 9600 baud – I'm using 115200. Roughly 960 characters per second vs 11520 cps.
- The boards all come with a built-in 16MHz oscillator, so no need to source an wire up a 10MHz crystal. But make sure the board has a crystal rather than a wobbly ceramic resonator. (Uno, Leonardo, & Mega2560 have crystals, Nanos have resonators.) And they're affordable.
- Arduinos can be programmed to provide the same timer functionality used by the picPET to achieve high precision
- 16MHz provides higher resolution than 10MHz
- Most important to me, extra functionality can be added to the Arduino, such as reporting air pressure, humidity and temperatures as well as pendulum period
- Arduino programming is aimed at the hobbyist, and it's free. No special equipment is needed. There is a learning curve because the devices are programmed in C/C++, but much of the behind the scenes complexity is hidden. Most advantageous is the existence of many libraries and working examples, which make using all the common sensors simple. Most of these have been modularised to make the electronics hobby friendly, plugging components into a breadboard rather than soldering. Soldering is only necessary in the production version, because breadboard connections eventually become unreliable.
Disadvantage: accuracy depends on the 16MHz crystal, which is not intended for high-accuracy work. Could be replaced but I hate soldering sub-miniature electronics. Some chips, like that in the Leonardo, can be clocked from an external pin connected to a better oscillator, but only up to 6.4MHz, which is inferior to a picPET,
Example of Arduino Precision Timer here. I believe it works, but as always, comments welcome!
Same job could be done with more powerful members of the PIC family, but I'm less enamoured of them for historical reasons. My first microcontroller projects were PIC but this was back when you made your own boards, the programming environment was for experts, sensors were poorly supported, and one either bought an expensive chip burner or bodged one: mine used the parallel printer port driven by a special program. Everything was hard work! Arduino, when it arrived, had many improvements: lessons had been learned! Far more straightforward: board ready to go, built-in burner programmed via standard USB, and a simplified development environment. Not suitable for everything – there are glass ceilings – but the environment is more than powerful enough for most hobby needs.
Dave
17 January 2023 at 12:36 #629837duncan webster 1
Participant@duncanwebster1This is similar to the Mumford regulator, but goes into PID control a bit. Went right over my head, might have been the effect of the wine I'd just had!
17 January 2023 at 22:59 #629913duncan webster 1
Participant@duncanwebster1When I went to SOD's link the cupboard was bare. Said 'this item has been deleted'. Any clues?
According to leapsecond.com you can drive a picpet with 20 Mhz, no intention of going back to pics, they made my head hurt, and that was 10 years ago at least
Edited By duncan webster on 17/01/2023 23:05:38
-
AuthorPosts
- Please log in to reply to this topic. Registering is free and easy using the links on the menu at the top of this page.
Latest Replies
Home › Forums › Clocks and Scientific Instruments › Topics
-
- Topic
- Voices
- Posts
- Last Post
-
-
Adjustable spanner thread direction
Started by:
 jimmy b
in: Workshop Tools and Tooling
- 4
- 4
-
11 July 2025 at 19:50
 peak4
peak4
-
I’m Under Pressure
1
2
Started by:
howardb in: Related Hobbies including Vehicle Restoration
- 16
- 30
-
11 July 2025 at 19:12
Nealeb
-
Farm Boy
1
2
…
4
5
Started by:
Dalboy in: I/C Engines
- 15
- 102
-
11 July 2025 at 18:48
Diogenes
-
Another Day … Another ScumBag
Started by:
 Michael Gilligan
in: The Tea Room
- 9
- 14
-
11 July 2025 at 18:36
bernard towers
-
Sanjay’s Banjo Engine
Started by:
 JasonB
in: Stationary engines
- 3
- 9
-
11 July 2025 at 17:32
renardiere7
-
buying machine tools from aliexpress experiences?
Started by:
Jake Middleton-Metcalfe in: Manual machine tools
- 12
- 15
-
11 July 2025 at 17:17
larry phelan 1
-
Old plastic handled screwdrivers
Started by:
 Dave Halford
in: Workshop Tools and Tooling
- 12
- 14
-
11 July 2025 at 17:14
 Robert Atkinson 2
-
Bridgeport ways and wear
Started by:
inline in: Manual machine tools
- 7
- 18
-
11 July 2025 at 09:16
Ian Owen NZ
-
Maisie lubricator
Started by:
ferroequinologist in: Locomotives
- 9
- 14
-
11 July 2025 at 09:09
Clive Foster
-
Sat nag
1
2
Started by:
duncan webster 1 in: The Tea Room
- 13
- 26
-
11 July 2025 at 07:11
 Nicholas Farr
-
Transwave converter – plugged in motor, tripped RCD
Started by:
ell81 in: Beginners questions
- 8
- 12
-
10 July 2025 at 22:56
Master of none
-
Eight Trains
Started by:
 Vic
in: The Tea Room
- 1
- 1
-
10 July 2025 at 14:14
 Vic
Vic
-
motor and switch wiring Myford ML7
Started by:
1957jmh in: Workshop Tools and Tooling
- 3
- 5
-
10 July 2025 at 12:02
noel shelley
-
Help Wire 3 Phase 2 Speed Motor
Started by:
Allan Day in: Electronics in the Workshop
- 13
- 23
-
10 July 2025 at 11:57
Andrew Skinner
-
Square end on round stock – Milling?
1
2
Started by:
Roger TheShrubber in: Workshop Tools and Tooling
- 16
- 29
-
10 July 2025 at 10:49
 Julie Ann
-
Easiest/cheapest source of R8 socket
Started by:
Beardy Mike in: Workshop Tools and Tooling
- 8
- 10
-
10 July 2025 at 10:16
Pete
-
New (but well aged) member
Started by:
mikemunson in: Introduce Yourself – New members start here!
- 6
- 6
-
10 July 2025 at 09:23
 Dell
Dell
-
Bosch PBD 40 bearing upgrade
Started by:
th1980 in: Manual machine tools
- 5
- 11
-
9 July 2025 at 22:00
th1980
-
Bearing boxes for ball race
Started by:
Paul McDonough in: Beginners questions
- 11
- 20
-
9 July 2025 at 20:38
old mart
-
Twin Engineering’s heavy mill/drill quill removal
1
2
Started by:
Martin of Wick in: Manual machine tools
- 11
- 34
-
9 July 2025 at 19:42
old mart
-
File backup to external hard drive, incremental etc?
Started by:
Peter Bell in: The Tea Room
- 11
- 17
-
9 July 2025 at 13:50
 Graham Stoppani
-
Boiler Design – issue 4765
1
2
…
7
8
Started by:
Charles Lamont in: Model Engineer & Workshop
- 26
- 186
-
9 July 2025 at 12:28
Paul Kemp
-
Taylor Hobson cutter grinder modificaton
1
2
Started by:
 David George 1
in: Workshop Tools and Tooling
- 9
- 34
-
8 July 2025 at 23:53
 Bazyle
-
Angle grinder woes
Started by:
Speedy Builder5 in: Workshop Tools and Tooling
- 5
- 8
-
8 July 2025 at 18:26
DC31k
-
in line oil check valve
Started by:
 Garry Coles
in: General Questions
- 5
- 5
-
8 July 2025 at 18:05
salatipa
-
Adjustable spanner thread direction
-


