Last night watching a boring film on telly, I tackled the problem of extracting Q from my clock's data log. It contains nearly half a million records, including an accurate measure of the pendulums period.
Pendula have a number of characteristics, most obviously how long each swing takes. Nearly as important is 'Q', which is a measure of the pendulum's "goodness". It's the ratio between power stored and power consumed.
Q = 2π × storedEnergy ÷ energyLostPerSwing
An ideal pendulum would lose no energy and swing forever after a single impulse. Real pendulums lose energy stirring air and in the suspension. After building a low-loss suspension, running the pendulum in a vacuum increases the Q by a factor of about 5.
One way of measuring Q is to set a pendulum swinging and measure how long it takes to the amplitude to halve, the time being multiplied by 4.5 The method is tedious and not particularly accurate unless special care is taken. Another way, when a log is available, is to determine the signal's bandwidth from the distribution of tick times. Then:
Bandwidth = resonant frequency ÷ Q
The maths is explained in more detail here.
For my purposes, coding in Python with the numpy (Numeric Python) module, the calculation is rather easy because numpy comes with a percentile function. Given a list of periods, the resonant frequency is the 50% percentile and the bandwidth is the difference between the 70.7 and 29.3 percentiles. In python:
# Q
h, l, r = numpy.percentile(ticks, [70.7,29.3,50] )
b = h – l
q = r / b
print('Q',q)
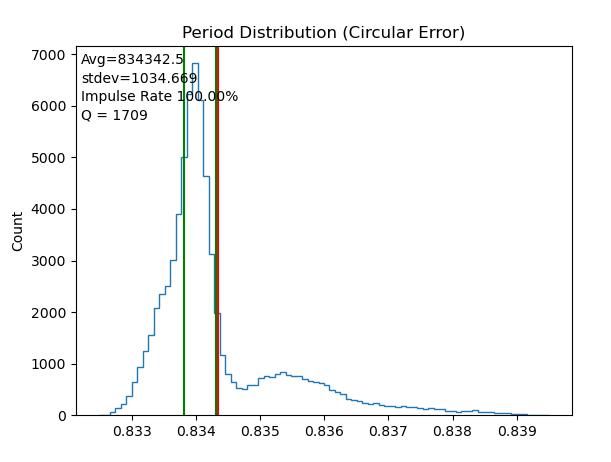
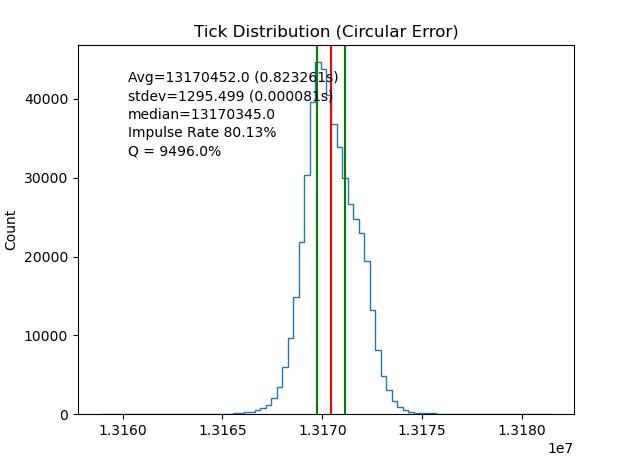
Bandwidth of the tick distribution shown graphically, green lines, below:

Thus my pendulum has a Q of 9496. This is in the range Q=3000 to 15000 given by Rawlings for Regulator pendulums in Air. It suggests the suspension spring I made from a disposable safety razor blade is acceptable.
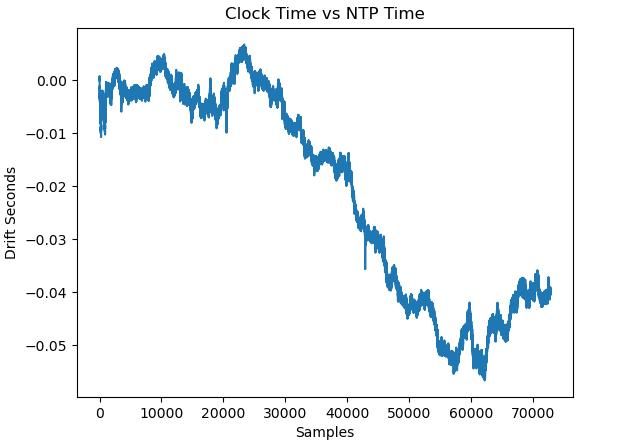
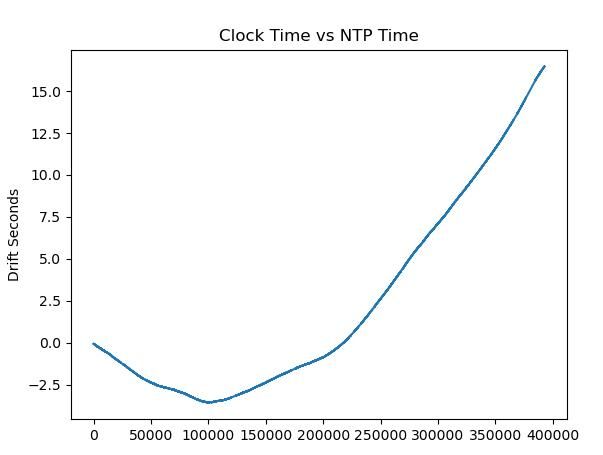
Sharp-eyed clock-aficionados will have noticed not all is well with graph above. The distribution, which should be balanced around the red-line is skewed in favour of fast periods. Coupled with the rate graph, it appears my pendulum is speeding up. The clock is now 29 seconds fast after 4 days 15 hours (poor). The drift probably explains why Q is dropping, last night it was nearly 9600, now it's 9350. I think the apparent bandwidth increases as the clock drifts.
On the plus side the new clock software is working well on my dining table. GPS measures the Arduino crystal once per second, and the calculated correction measures pendulum period more accurately than before.
Next job is to find an undisturbed place for the clock in my house with a good GPS and Wifi signal. This is difficult!
Dave
duncan webster 1.


 S decode looks right too. 127.321327 was 00:02:07 GMT on Thursday 1st January 1970.