Posted by Andrew Johnston on 27/11/2022 20:35:13:
How do you know that the Arduino Clock Cycle is accurate and stable? A quartz crystal probably won't vary enough to give the results seen. But they do drift, usually 50 to 100ppm at the lower cost end. Stability is also dependent on the quality of the oscillator. Presumably there is softare between the crystal oscillator and the measurement being made?
AND
Apart from Andrews comments re the reference, if this is the first period of running, could it be due to changes in the flexture? Either work hardening or fatigue. I guess use as a pendulum flexture was not on the razor designers mind when the chose the steel for the blade.
On references, how do you know the Arduino crystal is 15.998101 MHz? The crystals used for microcotrollers are not known for their accuracy.
Confession, I'm a bit of a electronics "time nut" with 6 GPS disciplined oscilators / clocks, half a dozen Rubdium atomic oscillators, several high performance crystal ocillators, counters to 20 picosecond resolution and frequency difference measurement to better than 1 part in 100,000,000,000. I normally have 3 references running.
Robert G8RPI.
Good questions. The microcontroller is a Sparkfun Pro Micro, a miniaturised version of an Arduino Leonardo. It comes with a quartz crystal rather than a cheap unstable ceramic resonator. However, the crystal is an ordinary 50 – 100ppm type, there's no capacitor, and I've made no attempt to stabilise the temperature.
The microcontroller measures the number of crystal ticks per swing and for best resolution this is mostly done in hardware. The 16MHz system clock feeds a hardware counter triggered on/off by the pendulum blocking an IR beam. The counter is zero at start and on overflow, it clocks another counter. When the off signal is received both counters are frozen and a simple sum gives the total number of crystal pulses per swing. As the counters run at 16MHz, the pendulum is measured in ticks of about 0.0625 microseconds, considerably better than doing the same in software (worse than 4 microsecond resolution.) Accuracy depends on the quartz crystal, which of course could be wrong by 100 parts per million, and is temperature sensitive.
The same counter technique can be used to measure the actual frequency of the crystal. Substituting the seconds pulse output of a GPS module for the pendulum, the microcontroller counts the number of oscillations made in one second. This can be repeated and averaged.
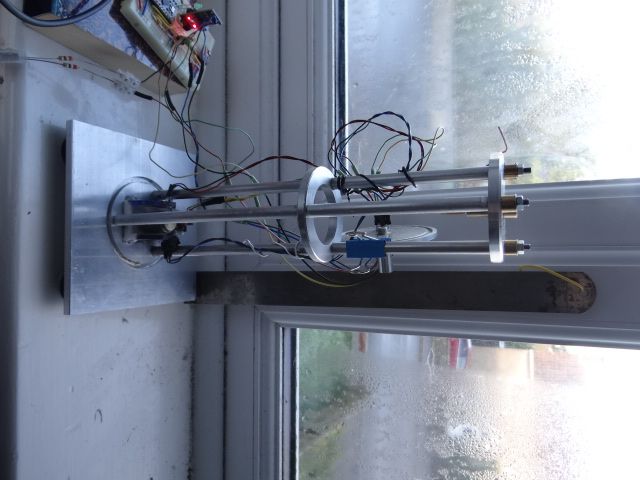
In the clock, during the 0.8s between swings, environmental data is read, and everything logged to a Raspberry Pi3B.
The data is:
13432949 0.7461 200 0 994.76 81.29 14.87 836040 1669630663 148802507
Tick Count – 13432949
'Amplitude' – 0.7461 (actually a measure of how fast the pendulum is swinging, used to decide if an impulse is needed)
Pulse – 200 How long the magnet is switched to impulse the bob
Power – 0 (false) Whether or not the magnet was impulsed.
Pressure – 994.76mb
Humidity – 81.29% Relative
Temperature – 14.87°C
Nominal Clock Period – 836040uS. The uncompensated period used by the stand-alone clock. (Should be 835650)
Clock Time as UNIX Timestamp – 1669630663. Number of seconds since 00:00:00GMT 1/1/1970
Clock Time UNIX subseconds – 148802507. Fractional part of UNIX timestamp.
In the current set up I'm measuring the crystal's average frequency by comparing it with Network Time. The Raspberry Pi3B is connected to the internet and synchronises using NTP every 38 minutes. It timestamps log data on receipt, making it possible to compare pendulum clock time with network time, but otherwise has little else to do that might interfere. The arrangement isn't brilliant, but the Pi3B's notion of time is always better than 0.1s accurate, making it suitable for long-term comparisons. The number of crystal ticks counted over several accurate hours gives the frequency. I should also analyse the data by time slots, to see how the average frequency alters hour by hour.
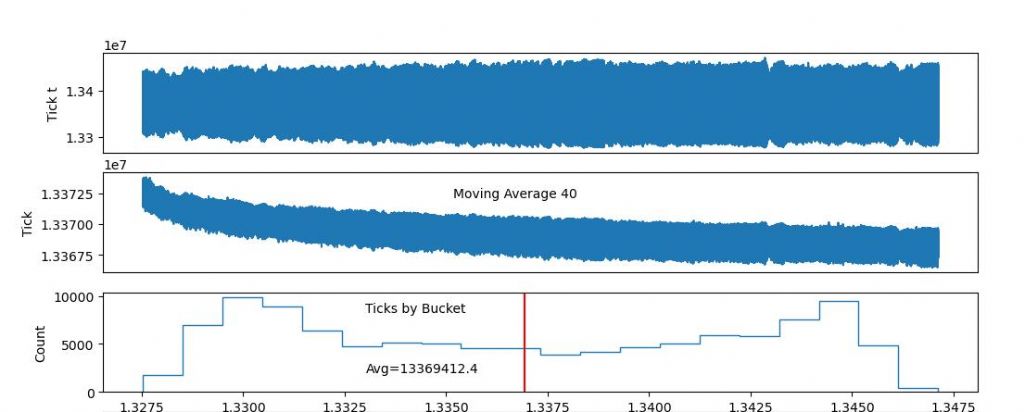
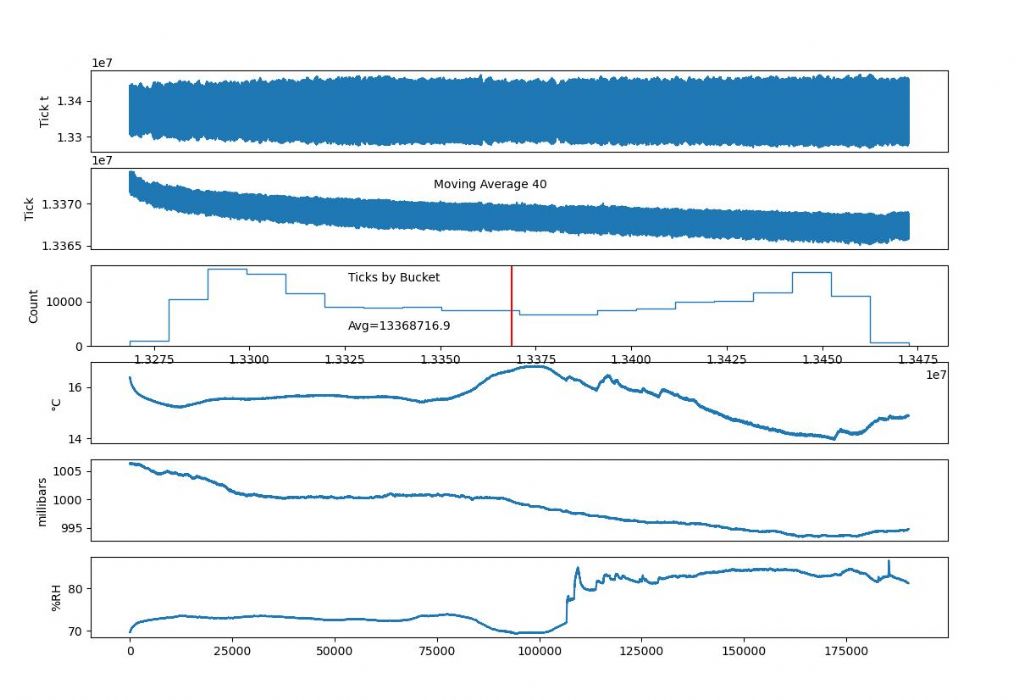
Until this morning, results suggested the experimental clock wasn't sensitive to the environment, but today suggests it could be tracking air-pressure. In the graphs below, the moving average falls with the millibar line until this morning when both lift together. Far from conclusive! I need to let the clock run for a lot longer. 
I'm flummoxed by the shape of the 'Ticks by Bucket' graph. Next job is to check my code for the fifth time! Maybe I've misunderstood matplotlib or messed up the analysis. Otherwise I can't imagine how a pendulum's period could vary like that.
Robert's point about this being the first period of running is good. Although the clock has been run several times to test it and the software, they were all short runs. This is the first long one and perhaps it's shaking down. If so, it's taking a long time!
Let Robert's confession to being a 'time-nut' be a dire warning to others. The pursuit of accuracy time is addictive. I'm wasting lots of time on this and lust after Rubidium too…
Dave
duncan webster 1.


